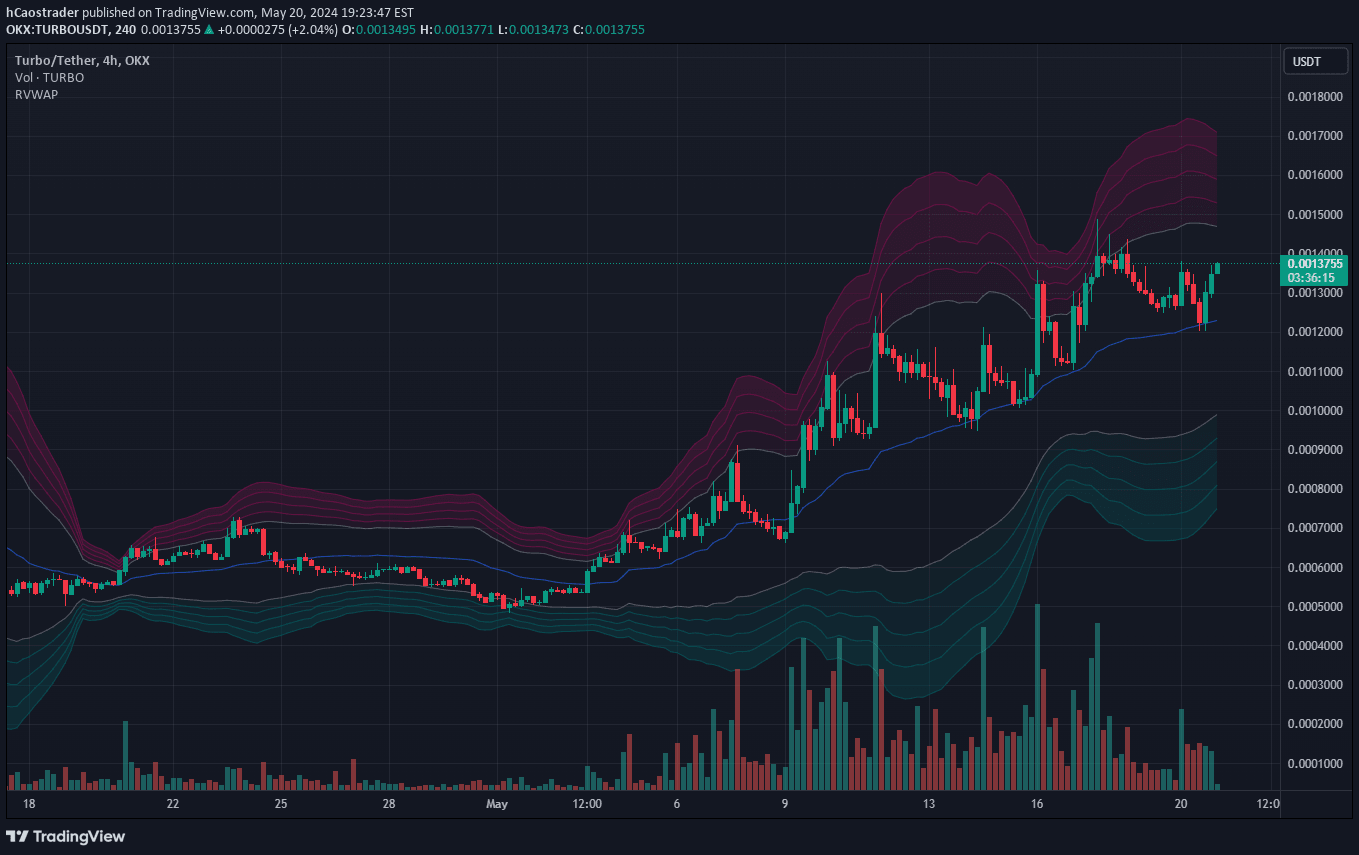
A dynamic indicator using exponential moving averages and average true range to identify potential overbought/oversold levels and dynamic support and resistance zones.
Explore complementary indicator rolesHow it works
The Dynamic Trend Ripper calculates multiple exponential moving averages (EMAs) with different lengths to create dynamic clouds above and below the price. It uses the average true range (ATR) to adjust these EMAs, creating adaptive support and resistance levels. The indicator plots top and bottom EMAs, forming colored clouds that change based on the trend direction.
The indicator creates overbought (OB) and oversold (OS) levels by adding or subtracting the ATR multiplied by a specific multiplier from the EMAs. These levels help traders identify potential price reversal zones and market momentum by visualizing dynamic support and resistance areas that adapt to current market volatility.
Why it may be useful
The Dynamic Trend Ripper provides traders with a sophisticated method of identifying potential market turning points by integrating multiple technical analysis concepts. By combining EMAs with ATR, the indicator offers a more responsive and adaptive approach to tracking market trends and potential reversal zones.
Traditional support and resistance indicators often fail to account for changing market volatility, but this approach dynamically adjusts to current market conditions. Traders can gain insights into potential overbought or oversold conditions, helping them make more informed decisions about market entry and exit points.
When to explore it
The Dynamic Trend Ripper works best in markets with clear trending characteristics, where price movements show consistent directional momentum. It is particularly effective in volatile markets where traditional static support and resistance levels might not provide accurate insights.
Traders should use this indicator in conjunction with other technical analysis tools to confirm signals and validate potential trading opportunities. It is most reliable when applied to liquid markets with sufficient trading volume and when used across multiple timeframes to cross-reference signals.
Keep exploring
What we’ve verified
Access, alerts and repainting behaviour have not been independently verified for this indicator. Check the creator’s current publication and settings.
General descriptions and classifications are recovered research. Verified details above identify the specific checks we have completed. Check the creator’s current publication for later changes.