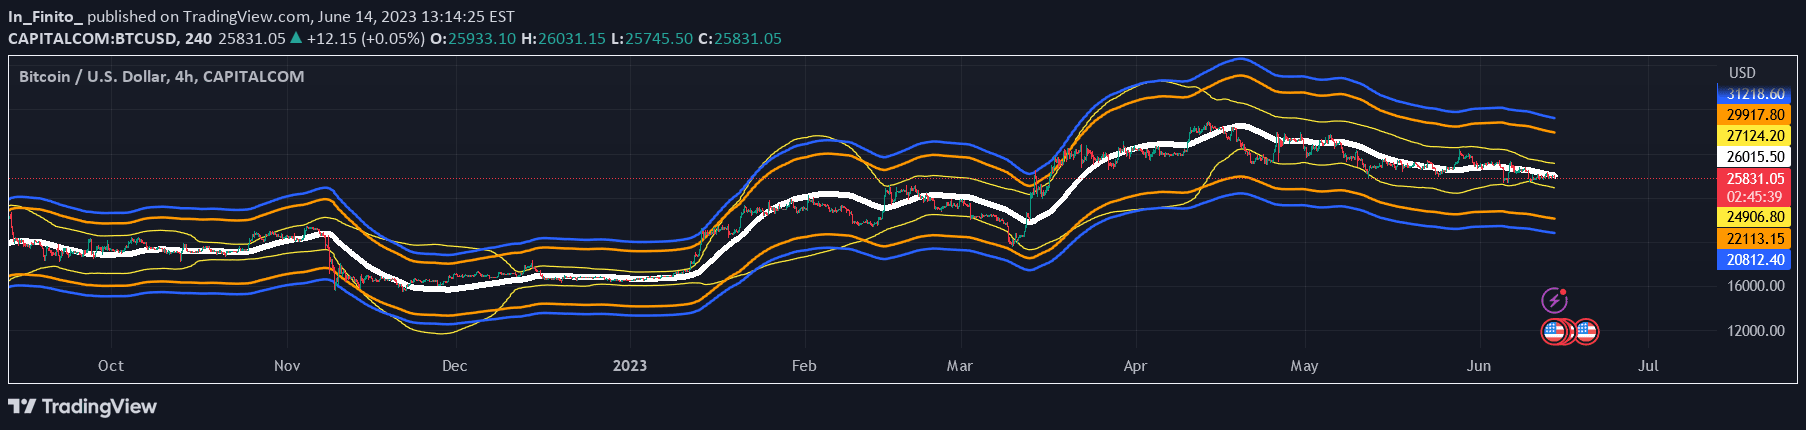
The E9 Bollinger Range is a technical indicator that tracks price volatility using Bollinger Bands and EMAs to identify potential trading opportunities and trend directions.
Explore complementary indicator rolesHow it works
The E9 Bollinger Range uses multiple Bollinger Band deviations to create different price levels and track market volatility. It plots bands around the price action, with the furthest deviation bands serving as warning indicators for potential overbought or oversold conditions.
Simultaneously, the indicator incorporates two EMAs (50 and 200) to filter out false signals and provide additional trend context. The system also employs visual bar coloring to clearly indicate trend direction, with green bars representing uptrends and red bars representing downtrends.
Why it may be useful
The E9 Bollinger Range provides traders with a comprehensive view of market dynamics by combining volatility measurement, trend identification, and visual trend signals. By integrating multiple technical analysis components, it offers a systematic approach to understanding price movements and potential market corrections.
The indicator's strength lies in its ability to help traders identify potential entry and exit points by highlighting price extensions, trend directions, and volatility changes. This multifaceted approach enables traders to make more informed decisions by considering both price action and underlying market trends.
When to explore it
The E9 Bollinger Range is most effective in markets with clear trending characteristics and moderate to high volatility. It performs exceptionally well in liquid markets such as forex, stocks, and cryptocurrencies where price movements are more predictable and consistent.
Traders should utilize this indicator during periods of significant price action, particularly when looking to identify potential trend reversals or continuation patterns. It is especially useful in identifying overbought and oversold conditions, making it valuable for traders seeking to capitalize on market corrections and potential trend shifts.
Keep exploring
What we’ve verified
Access, alerts and repainting behaviour have not been independently verified for this indicator. Check the creator’s current publication and settings.
General descriptions and classifications are recovered research. Verified details above identify the specific checks we have completed. Check the creator’s current publication for later changes.