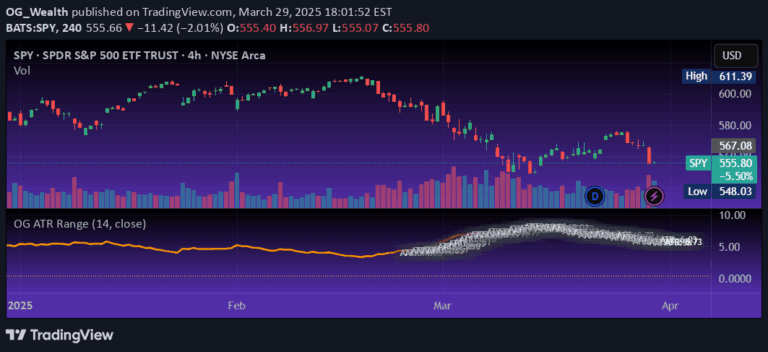
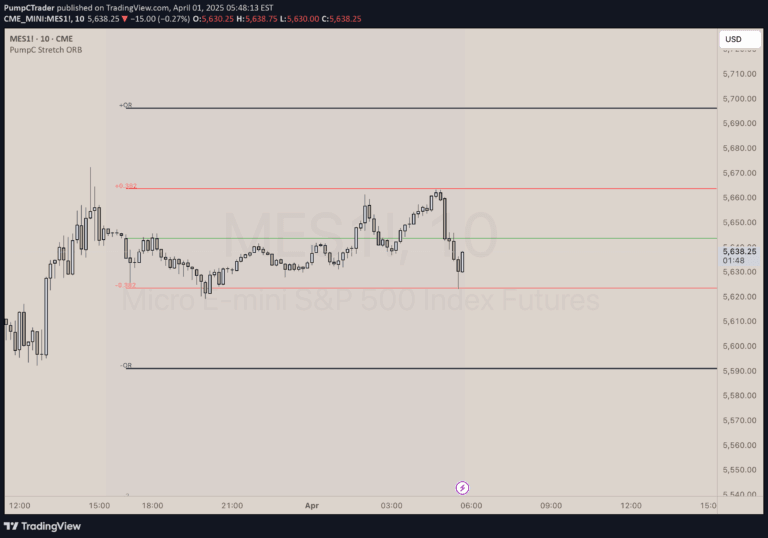
An advanced Bollinger Bands variant that uses ATR-based smoothing and squeeze detection to identify potential breakouts and market volatility changes with enhanced adaptability.
Explore complementary indicator rolesHow it works
The Bollinger Bands ETstyle calculates a moving average as the basis and plots upper and lower bands at user-selected standard deviations. These bands dynamically expand and contract to represent price volatility, with optional ATR smoothing to adjust band width based on current market conditions.
When ATR smoothing is enabled, the band width automatically adjusts using the Average True Range, making the indicator more responsive to changing market dynamics. The script also computes the relative band width, and when this falls below a specified threshold, it highlights the background to indicate a potential volatility squeeze.
Why it may be useful
The Bollinger Bands ETstyle provides traders with a sophisticated tool for understanding market volatility and potential price movements. By combining traditional Bollinger Bands with ATR-based smoothing, the indicator offers more adaptive and precise insights into market conditions, helping traders identify potential breakout opportunities.
This advanced approach reduces false signals and provides clearer visual cues about market tension and potential trend changes. The customizable nature of the indicator allows traders to fine-tune its sensitivity to match specific trading styles and asset characteristics.
When to explore it
The Bollinger Bands ETstyle is most effective during periods of changing market volatility, particularly when price appears to be consolidating or preparing for a significant move. Traders can use this indicator to identify potential breakout setups, especially when the background highlight indicates a volatility squeeze.
It works particularly well in trending and range-bound markets, helping traders anticipate potential trend continuations or reversals. The indicator is especially useful for traders seeking a more dynamic and adaptive approach to volatility analysis across different timeframes and market conditions.
Keep exploring
What we’ve verified
Access, alerts and repainting behaviour have not been independently verified for this indicator. Check the creator’s current publication and settings.
General descriptions and classifications are recovered research. Verified details above identify the specific checks we have completed. Check the creator’s current publication for later changes.