E9 ASIA Session
A specialized indicator tracking the Asia trading session's price dynamics, providing key session highs, lows, and visual markers to help traders understand market behavior during this crucial timeframe.
Explore 11,183 indicators. Filter beyond the obvious.
Discover the tools that fit the way you trade.
11,183 tools to explore
A specialized indicator tracking the Asia trading session's price dynamics, providing key session highs, lows, and visual markers to help traders understand market behavior during this crucial timeframe.
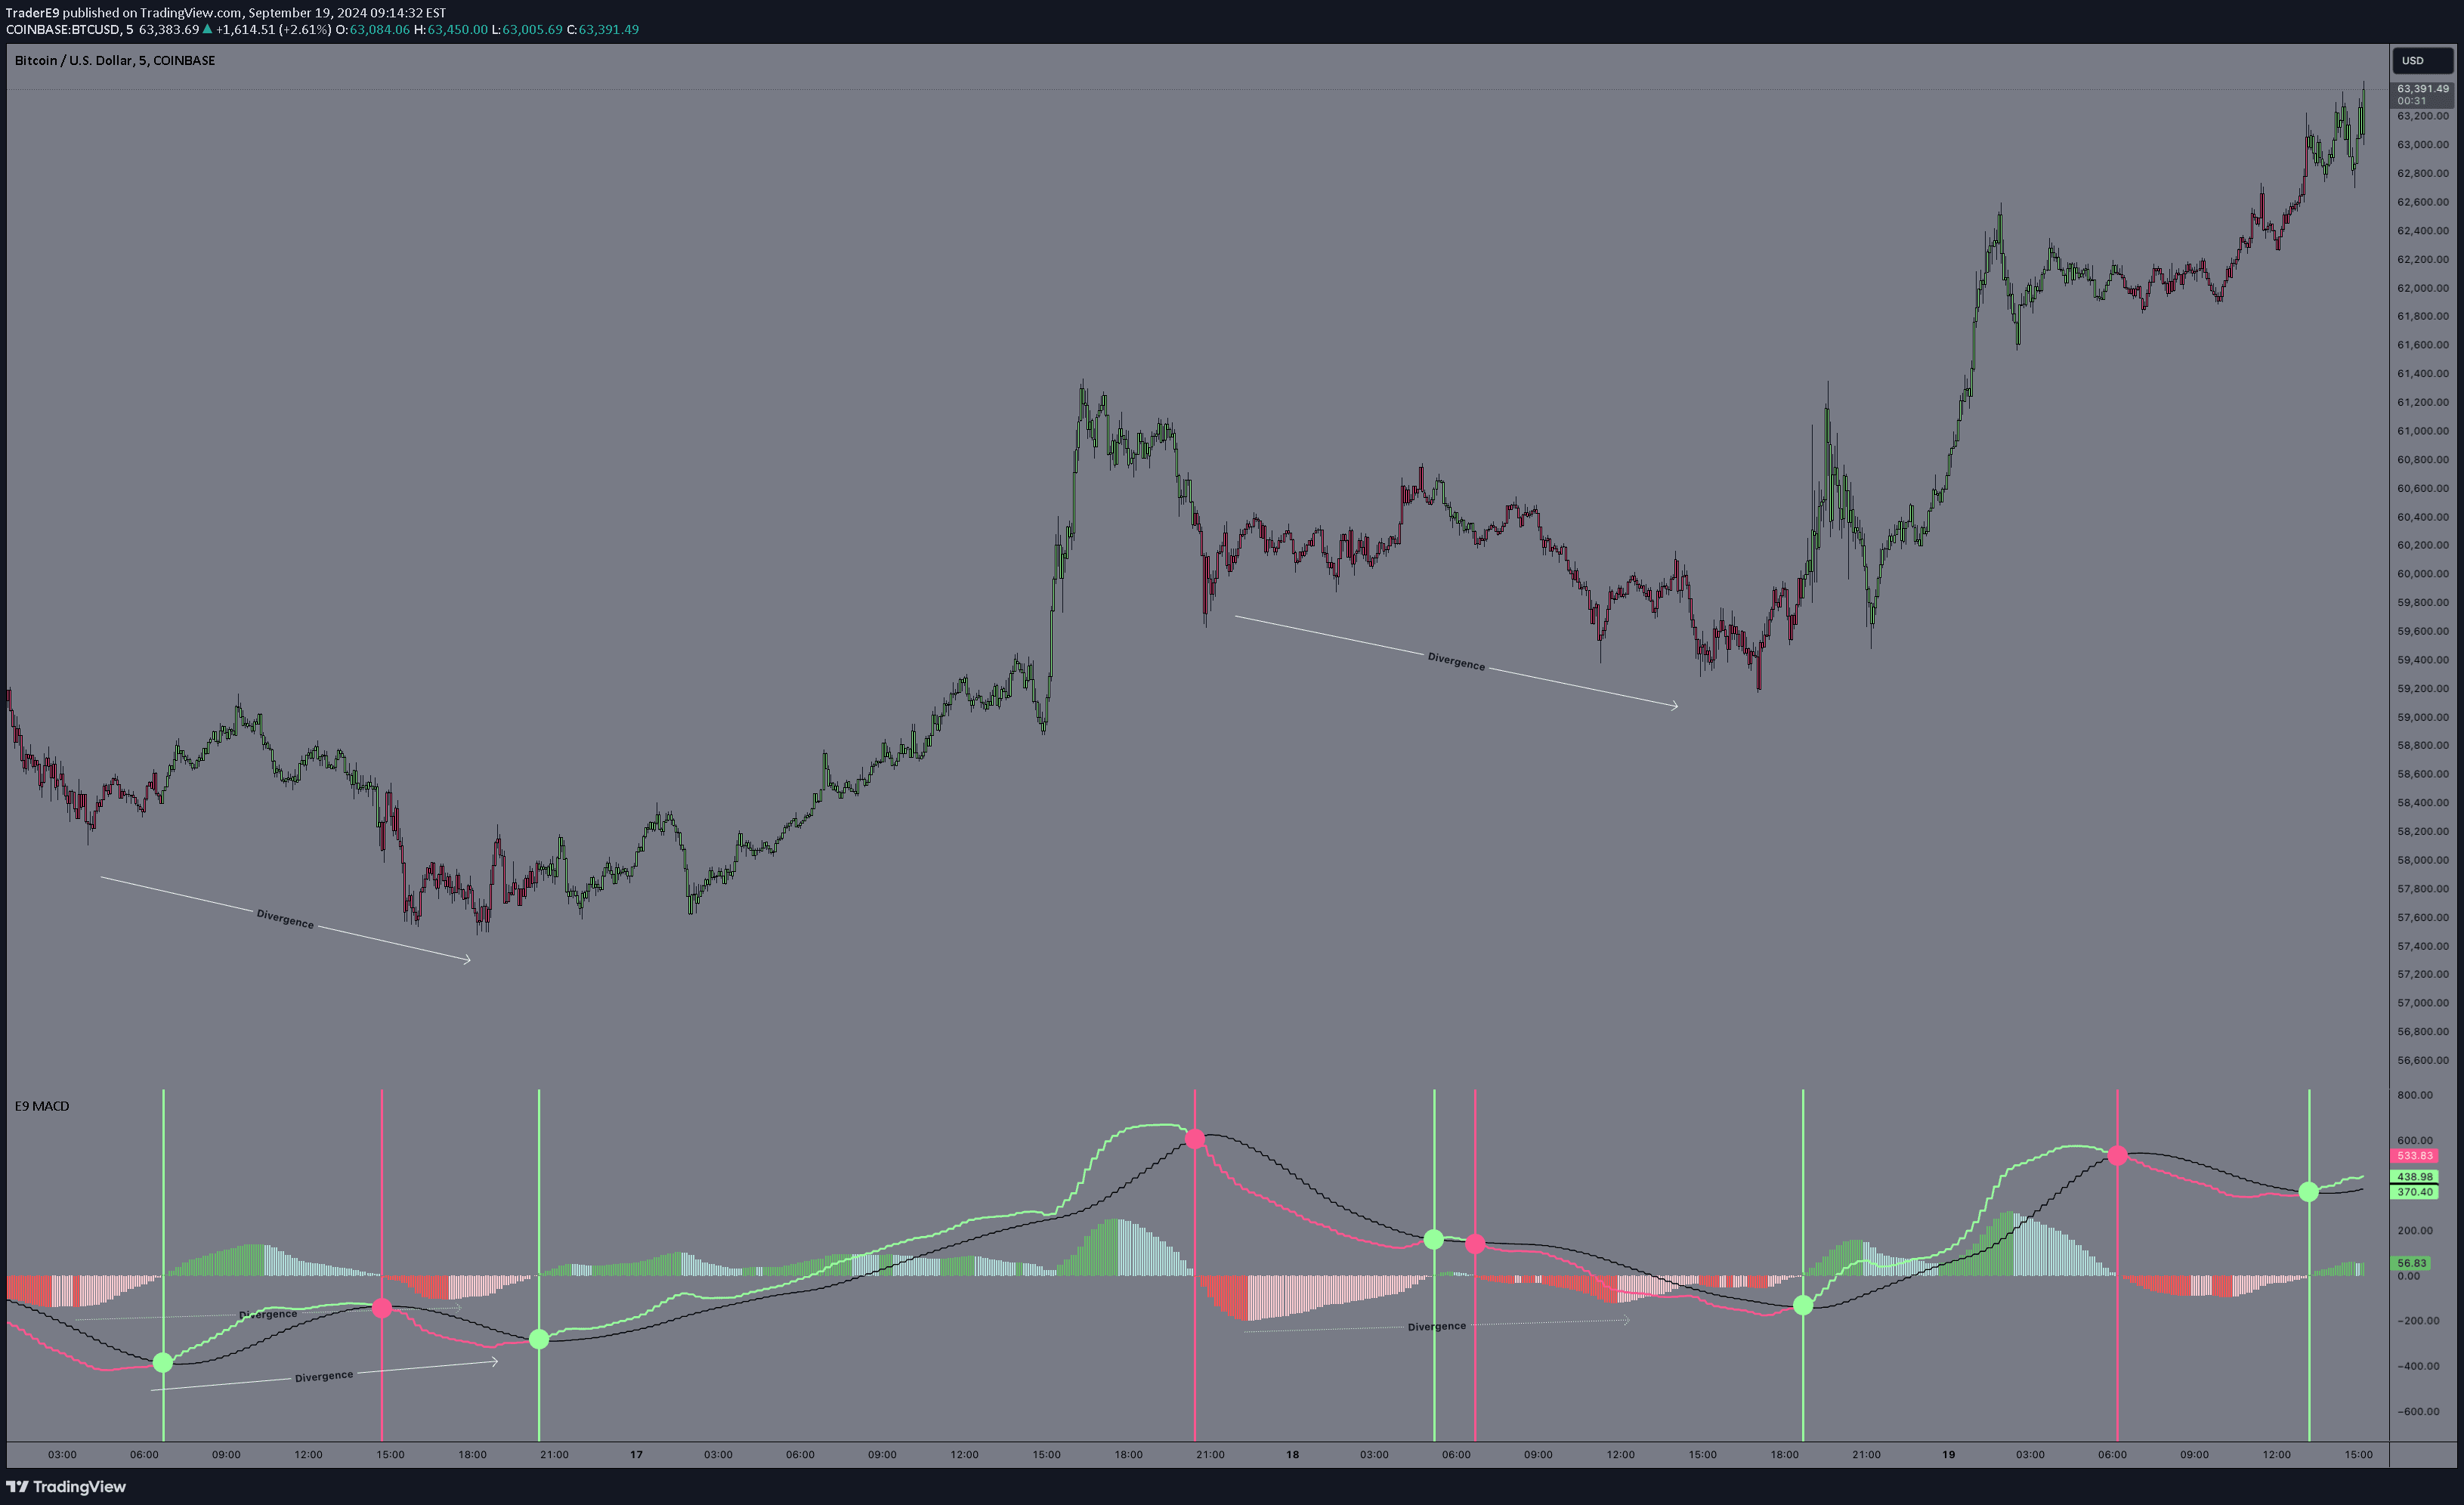
E9 MACD is a technical analysis tool that helps traders identify trend momentum, potential entry and exit points through moving average convergence and divergence analysis.
The E9 Bollinger Range is a technical indicator that tracks price volatility using Bollinger Bands and EMAs to identify potential trading opportunities and trend directions.
A custom indicator using power law regression to assess asset valuation by analyzing logarithmic price data and calculating deviation from expected long-term price trends.
A trading script that identifies wickless candles on higher timeframes, signaling strong market sentiment shifts and potential key support or resistance levels.
Likes, views, and comments are historical TradingView snapshots. They describe attention, not trading performance.