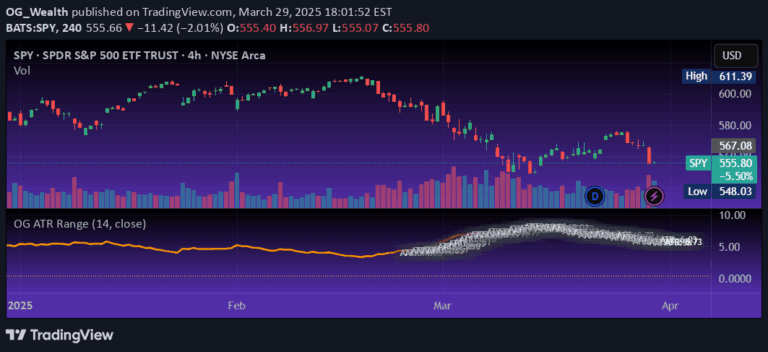
A volatility-based position sizing calculator that helps traders objectively allocate trade capital by scaling positions according to market volatility and risk parameters.
Explore complementary indicator rolesHow it works
The Turtle Trading Risk Adjusted Position Size Calculator uses the Average True Range (ATR) to measure market volatility and determine appropriate position sizing. It calculates a normalized position size by considering the asset's price, volatility, and a risk coefficient that reflects market uncertainty.
The formula accounts for dollar volatility, which represents how a $1 price change impacts the trading account. By scaling positions relative to market volatility, traders can maintain consistent risk exposure across different financial instruments and market conditions.
Why it may be useful
Position sizing is crucial for managing risk and preserving trading capital, yet many traders overlook its importance. This calculator provides a systematic approach to determining trade size that adapts to market conditions, helping traders avoid outsized losses during volatile periods.
By normalizing risk across different assets, the method allows traders to maintain a consistent risk profile regardless of the instrument being traded. This approach helps prevent emotional decision-making and promotes a more disciplined, mathematical trading strategy.
When to explore it
The Turtle Trading Position Size Calculator is most effective in markets with significant volatility variations, such as commodities, stocks, and cryptocurrencies. It is particularly valuable when trading multiple assets with different price ranges and volatility characteristics.
Traders should use this method when they want to implement a systematic risk management approach that adapts to changing market conditions. It is especially useful for traders who need to maintain consistent risk exposure across diverse trading instruments and timeframes.
Keep exploring
What we’ve verified
Access, alerts and repainting behaviour have not been independently verified for this indicator. Check the creator’s current publication and settings.
General descriptions and classifications are recovered research. Verified details above identify the specific checks we have completed. Check the creator’s current publication for later changes.