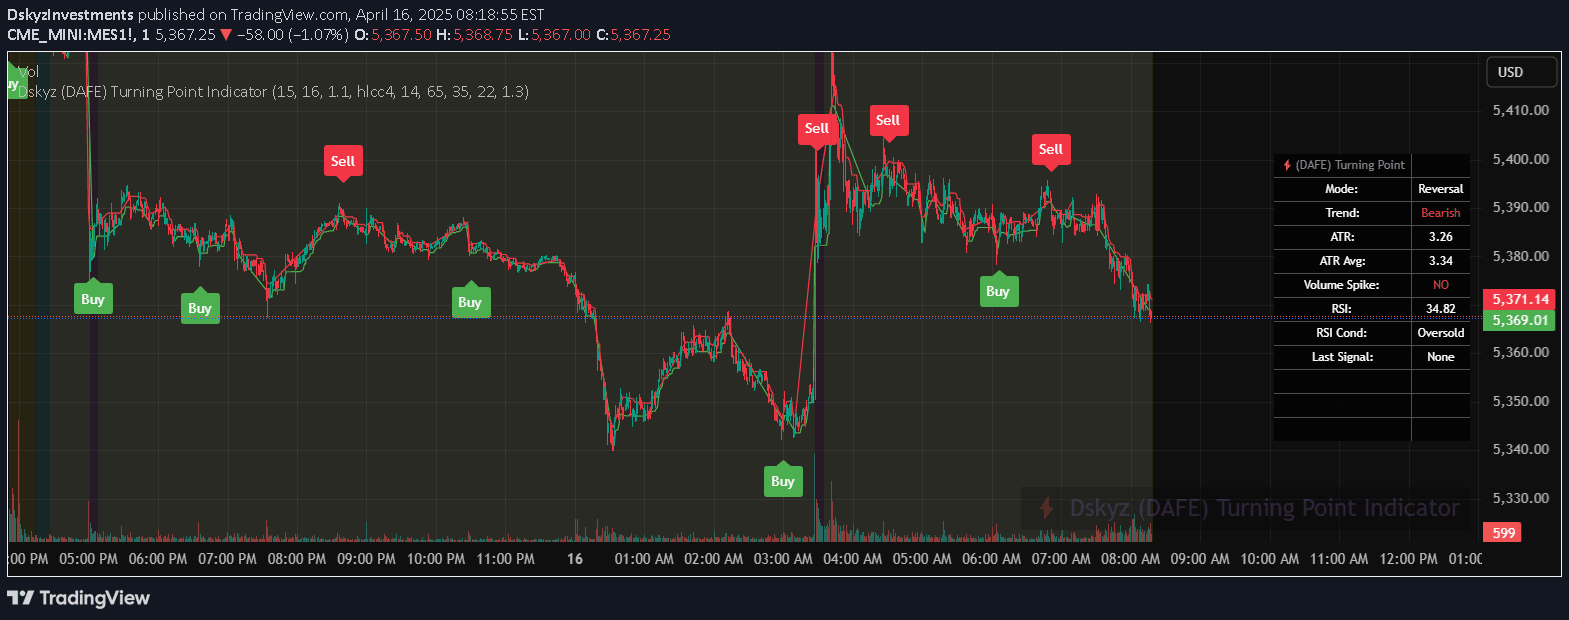
Dynamic Trailing Support & Resistance (DTSR) is an objective method for identifying support and resistance zones using calculated range thresholds and Fibonacci retracement levels.
Explore complementary indicator rolesHow it works
The Dynamic Trailing Support & Resistance (DTSR) indicator calculates support and resistance zones dynamically by analyzing price movements over a specified lookback period. It identifies the highest high (HH) and lowest low (LL) within that timeframe, creating proximal and distal lines that represent potential support and resistance zones.
The indicator goes beyond traditional technical analysis by objectively determining these zones using mathematical calculations. It incorporates Fibonacci retracement levels at 38.2% and 61.8% to provide additional intermediate support and resistance zones, giving traders a more comprehensive view of potential price reversals and trend continuations.
Why it may be useful
DTSR provides traders with an objective, mathematically-driven approach to identifying support and resistance zones, reducing the subjectivity often associated with traditional technical analysis. By using dynamic calculations and Fibonacci retracement levels, the indicator offers a more precise and adaptable method for understanding price movements and potential trend reversals.
The indicator's ability to dynamically adjust support and resistance zones allows traders to have a more responsive and accurate tool for analyzing market behavior. This approach helps traders make more informed decisions by providing clear visual indicators of potential price support and resistance levels across different timeframes.
When to explore it
The DTSR indicator is most effective in markets with clear trending or ranging behavior, where support and resistance zones play a crucial role in price movement. It works particularly well in volatile markets where traditional support and resistance lines may become less reliable due to rapid price changes.
Traders should use DTSR across multiple timeframes, from scalping to swing trading, to identify potential entry and exit points. It is especially useful when combined with other technical indicators to confirm trading signals and provide a more comprehensive market analysis strategy.
Keep exploring
What we’ve verified
Access, alerts and repainting behaviour have not been independently verified for this indicator. Check the creator’s current publication and settings.
General descriptions and classifications are recovered research. Verified details above identify the specific checks we have completed. Check the creator’s current publication for later changes.