Optimized Trend Tracker
Optimized Trend Tracker (OTT) is an advanced indicator designed to identify market trend direction and provide clear buy and sell signals based on price movements relative to the indicator line.
Explore 11,183 indicators. Filter beyond the obvious.
Discover the tools that fit the way you trade.
11,183 tools to explore
Optimized Trend Tracker (OTT) is an advanced indicator designed to identify market trend direction and provide clear buy and sell signals based on price movements relative to the indicator line.
A footprint bar indicator that visualizes volume or open interest data within the chart's visible range, offering three different heatmap styles to analyze trading activity.
A trailing stop strategy that uses market structure like Change of Character (CHoCH) and Break of Structure (BOS) to dynamically adjust stop-loss levels for protecting profits.
A derivative RSI indicator using a Moving Average with a trailing stop level that generates buy and sell signals based on crossovers and market conditions.
A trend-following indicator that dynamically detects market direction using SMA bands and provides automated visual cues for entries, stops, and targets directly on the chart.
A dynamic trendline indicator that tracks market trends across three different timeframes, using swing points and color-coded visualizations to highlight potential trend shifts and price movements.
An advanced technical indicator using dual EMAs and volatility-adjusted bands to detect market trends, providing dynamic and adaptive trend analysis across different market conditions.
RSI Trail is a technical analysis tool that uses Relative Strength Index and moving averages to dynamically plot support and resistance levels, helping traders identify market trends and potential entry/exit points.
A performance evaluation tool that calculates risk-adjusted return metrics like Sharpe, Sortino, and Omega Ratios to help traders assess investment performance and risk.
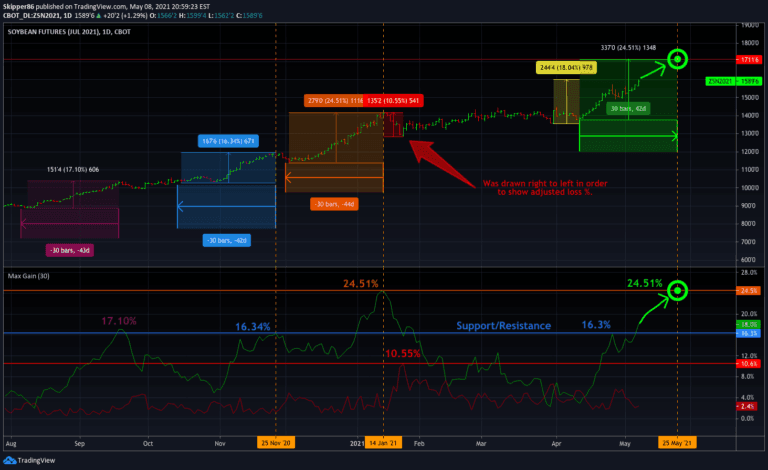
A trading indicator that calculates potential price targets by analyzing percentage gains and losses over a specified time period, helping traders identify potential resistance levels and performance targets.
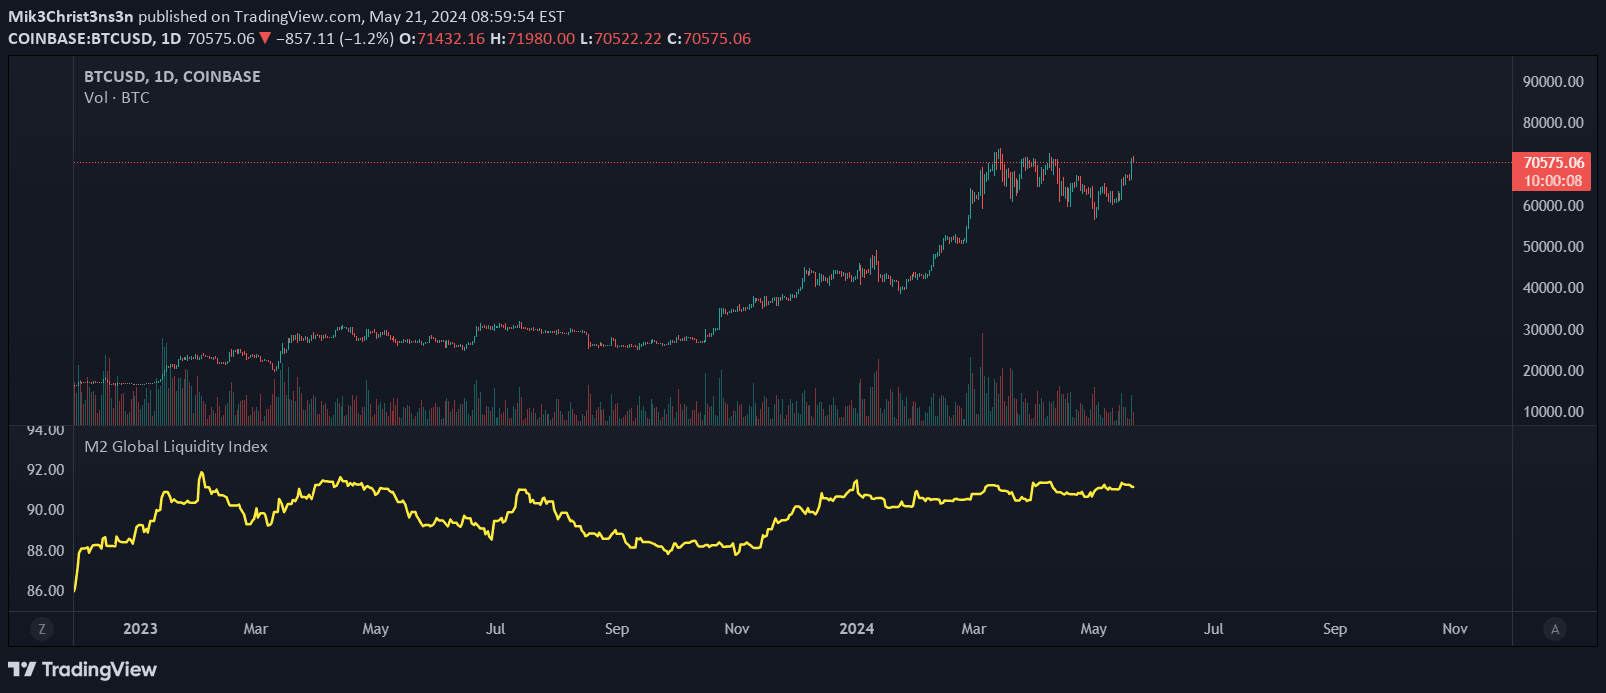
The M2 Global Liquidity Index tracks aggregate money supply across five major currencies, providing a comprehensive view of global economic liquidity and potential market trends.
FRAMA Channel is a dynamic trend-following indicator that adapts to market conditions, creating an adaptive channel around price to identify trend changes and market momentum.
Likes, views, and comments are historical TradingView snapshots. They describe attention, not trading performance.