
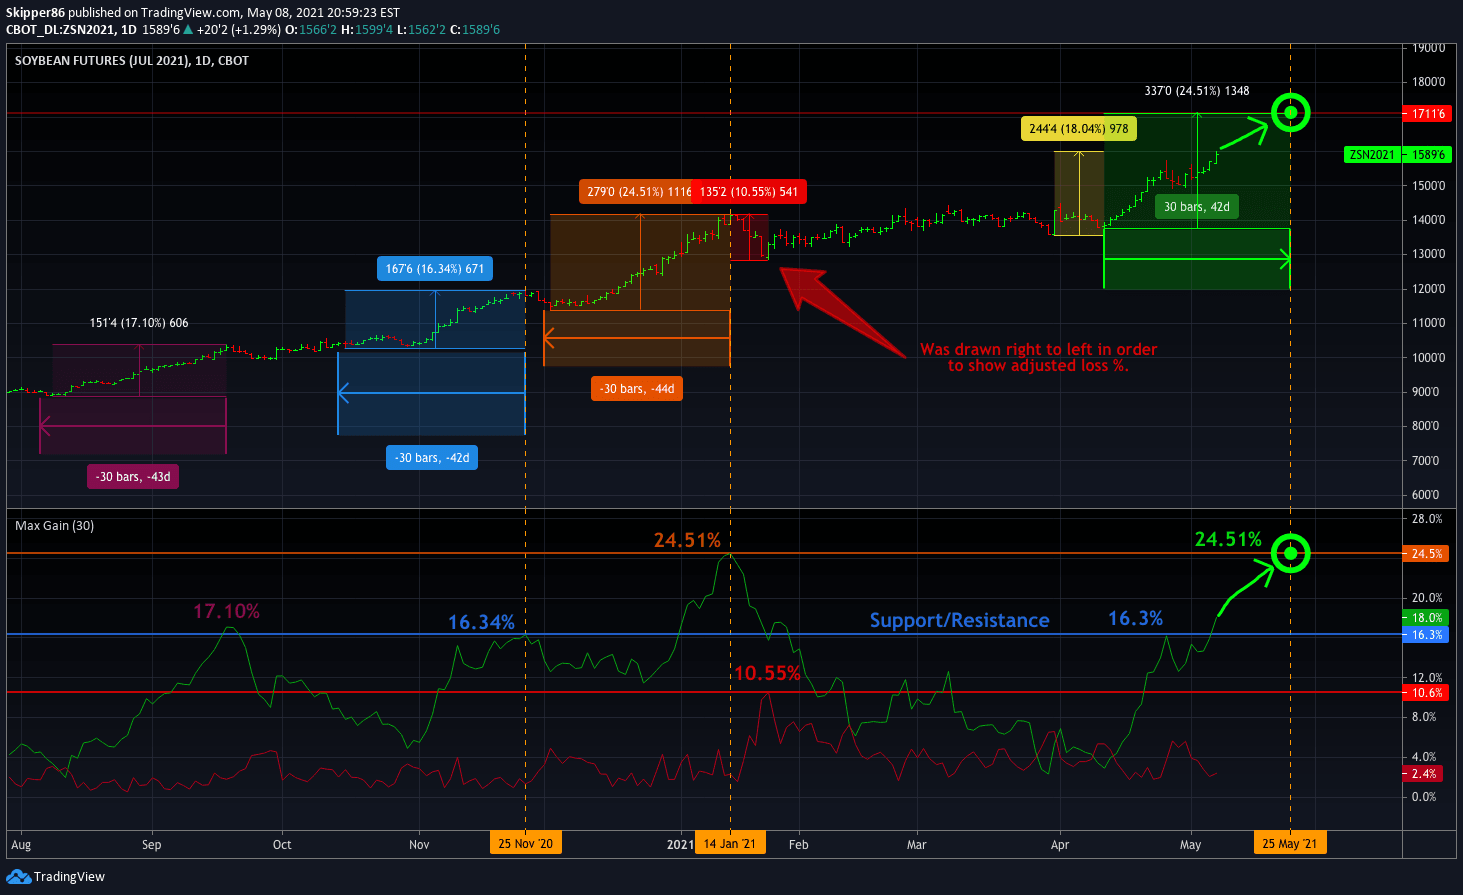
A trading indicator that calculates potential price targets by analyzing percentage gains and losses over a specified time period, helping traders identify potential resistance levels and performance targets.
Explore complementary indicator rolesHow it works
This indicator calculates percentage gains and losses over a specified time frame, typically 30 days. It plots green lines showing potential gains from current highs to previous lows and red lines showing adjusted percentage losses from current lows to previous highs.
The calculation adjusts for the mathematical asymmetry between percentage losses and gains, ensuring a more accurate representation of potential price movements. By tracking historical price performance, the indicator helps traders understand potential resistance levels and price targets
Why it may be useful
Traders can use this indicator to systematically analyze market performance and potential price targets. It provides a visual representation of historical price movements, helping traders understand potential resistance levels and expected gains.
The adjusted percentage calculations offer a more nuanced view of price performance, accounting for the mathematical differences between gains and losses. By presenting historical data in a structured manner, the indicator supports more informed trading decisions and strategic planning
When to explore it
This indicator works best in bull markets with consistent trends and predictable price movements. It is most effective for swing traders looking to identify potential price targets and resistance levels.
Traders should use it in conjunction with other technical analysis tools to confirm signals and validate potential trade opportunities. The indicator is particularly useful when analyzing stocks or assets with relatively stable price patterns and measurable momentum
Keep exploring
What we’ve verified
Access, alerts and repainting behaviour have not been independently verified for this indicator. Check the creator’s current publication and settings.
General descriptions and classifications are recovered research. Verified details above identify the specific checks we have completed. Check the creator’s current publication for later changes.


