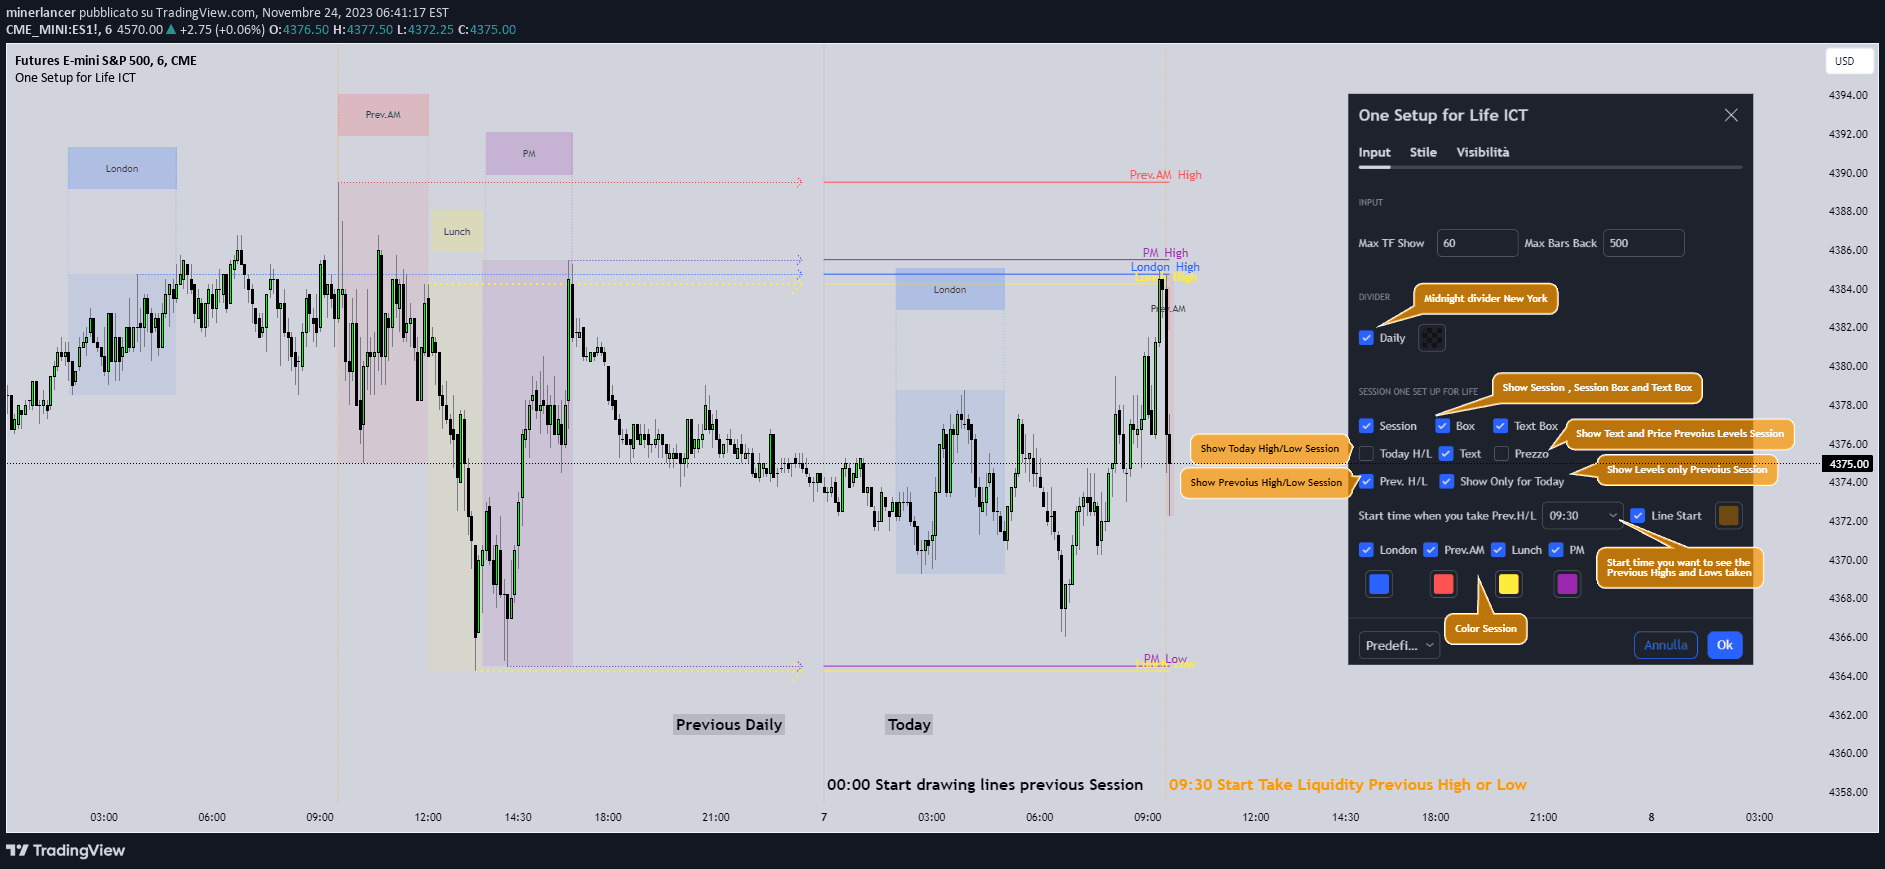
A custom TradingView indicator that marks key market structure levels across different trading sessions, highlighting previous day ranges, Asia session data, and 4-hour candle information.
Explore complementary indicator rolesHow it works
The indicator automatically tracks and visualizes multiple market structure elements across different trading sessions. It draws horizontal lines for previous days' highs and lows, creates color-coded markers for session boundaries, and generates a comprehensive visual representation of price ranges.
For each 4-hour period, the indicator generates a box showing the candle's high, low, midline, and quartile levels. It also places vertical time markers to help traders quickly identify key session transitions and potential trading zones.
Why it may be useful
Traders benefit from having multiple layers of market context visualized simultaneously, which helps in understanding price behavior across different timeframes and sessions. The indicator provides a comprehensive view of market structure, making it easier to identify potential entry and exit points.
By highlighting previous session ranges, Asia session levels, and 4-hour candle information, traders can make more informed decisions about market dynamics and potential price movements.
When to explore it
The indicator is most effective during intraday trading, particularly around New York and Asia session transitions. Traders can use it to identify reaction zones, potential reversal points, and key structural levels that might influence price movement. It is particularly useful for traders focusing on short-term strategies who need a quick visual reference of recent market structure and session-based price dynamics.
Keep exploring
What we’ve verified
Access, alerts and repainting behaviour have not been independently verified for this indicator. Check the creator’s current publication and settings.
General descriptions and classifications are recovered research. Verified details above identify the specific checks we have completed. Check the creator’s current publication for later changes.