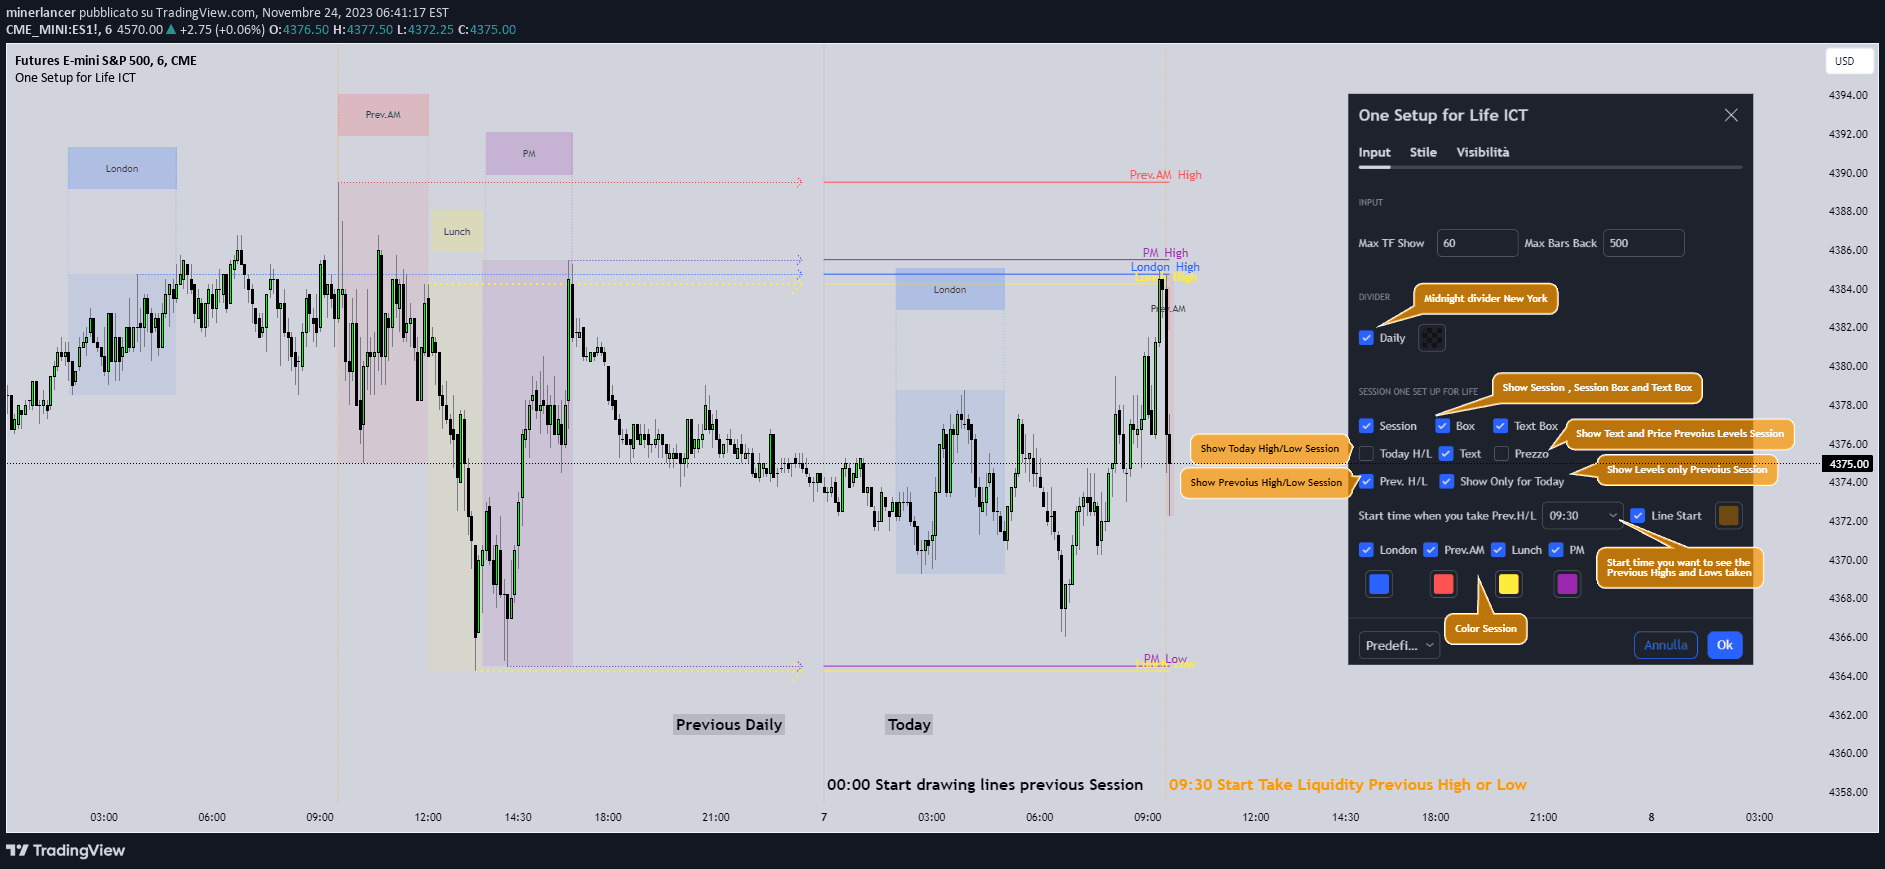
A futures trading indicator that automatically displays previous day's levels, weekly open/high/low, and Initial Balance Range to help traders identify key price zones and potential trading opportunities.
Explore complementary indicator rolesHow it works
The Futures Auto Levels indicator calculates and displays critical price levels from previous trading sessions. It automatically plots the previous day's open, high, low, and close prices as reference lines on the chart, providing traders with immediate visual insights into historical price performance. Additionally, it tracks the current week's open, high, and low prices to give broader market context.
The indicator also computes the Initial Balance Range (IBR) by measuring the price range during the first 60 minutes of trading. This range helps traders understand early market sentiment and potential directional bias for the trading day. By presenting these levels automatically, traders can quickly assess potential support and resistance zones without manual calculation.
Why it may be useful
The Futures Auto Levels indicator provides traders with a systematic approach to understanding market structure and potential price movements. By visualizing previous session levels and weekly ranges, traders can make more informed decisions about entry and exit points. These predefined levels help reduce emotional trading and provide objective reference points for strategic decision-making.
Moreover, the indicator offers multiple strategic perspectives by combining daily, weekly, and intraday levels. Traders can use these levels to identify potential reversals, confirm trend continuations, and set more precise stop-loss and take-profit orders. The automated nature of the indicator saves time and reduces the cognitive load of manual level identification.
When to explore it
The Futures Auto Levels indicator is most effective in liquid, actively traded futures markets with clear intraday price movements. It works particularly well during regular trading hours when volume is highest and price action is most predictable. Traders can leverage this indicator during trending and ranging market conditions, adapting their strategy based on the displayed levels.
The indicator is especially useful for day traders and scalpers who need quick, actionable insights into market structure. It can help identify potential breakout points, support and resistance zones, and provide context for short-term trading decisions. Traders should combine this indicator with other technical analysis tools to increase the probability of successful trades and confirm signal validity.
Keep exploring
What we’ve verified
Access, alerts and repainting behaviour have not been independently verified for this indicator. Check the creator’s current publication and settings.
General descriptions and classifications are recovered research. Verified details above identify the specific checks we have completed. Check the creator’s current publication for later changes.