
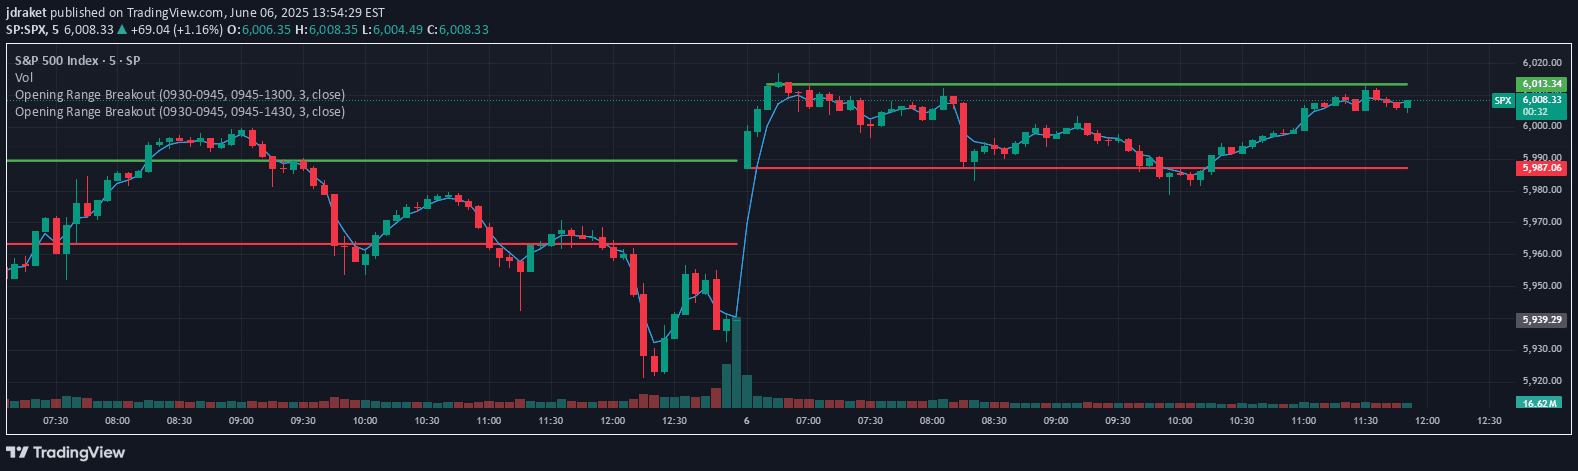
An Opening Range Breakout indicator that plots opening range highs and lows, using EMA for trend confirmation and generating bullish or bearish trading signals during market hours.
Explore complementary indicator rolesHow it works
The indicator first establishes an opening range during the first 15 minutes of market trading (9:30-9:45 am), plotting high and low lines. It then monitors price action from 9:45 am to 2:30 pm, tracking breakouts above or below these range lines. An exponential moving average (EMA) is used to confirm trend direction.
For a bullish breakout, the current price must be above the opening range high, with the EMA trending upward and positioned above the range high. Conversely, a bearish breakout requires price to be below the opening range low, with the EMA trending downward and positioned below the range low
Why it may be useful
This indicator helps traders identify potential trend reversals and momentum shifts during active market hours. By establishing a clear opening range and using EMA for trend confirmation, it reduces the likelihood of false signals. Traders can leverage this information to make more informed entry and exit decisions.
The systematic approach provides a structured method for analyzing intraday price movements. It offers a disciplined framework for understanding market dynamics and potential trading opportunities during the most liquid part of the trading day
When to explore it
The Opening Range Breakout indicator is most effective during regular market hours with high liquidity, particularly for day traders. It works best in stocks, ETFs, and futures with consistent trading volumes. Ideal market conditions include periods of moderate volatility and clear directional momentum.
Traders should use this indicator in conjunction with other technical analysis tools for comprehensive market assessment. It is particularly useful for identifying potential trend changes within the first few hours of market trading. The indicator provides valuable insights during active trading sessions with significant price movement potential
Keep exploring
What we’ve verified
Access, alerts and repainting behaviour have not been independently verified for this indicator. Check the creator’s current publication and settings.
General descriptions and classifications are recovered research. Verified details above identify the specific checks we have completed. Check the creator’s current publication for later changes.


