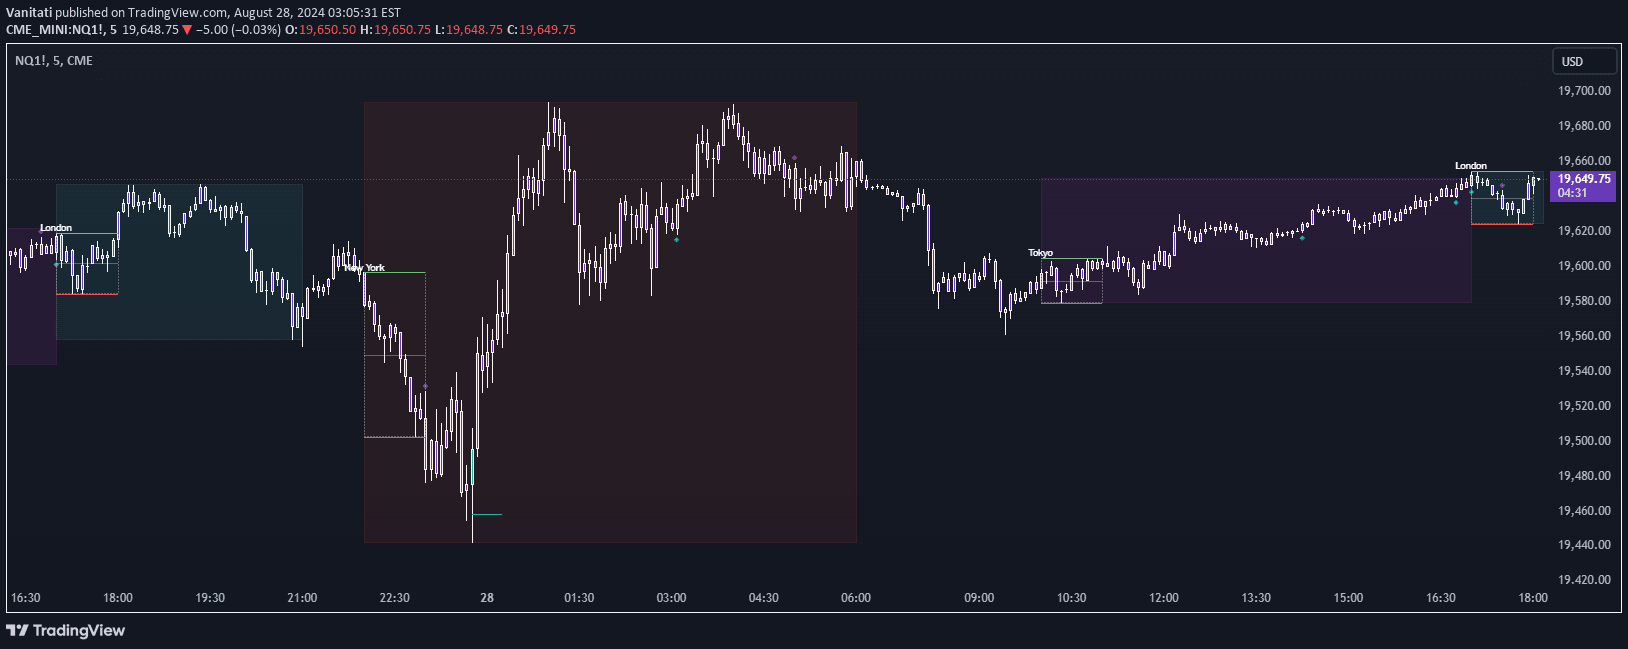
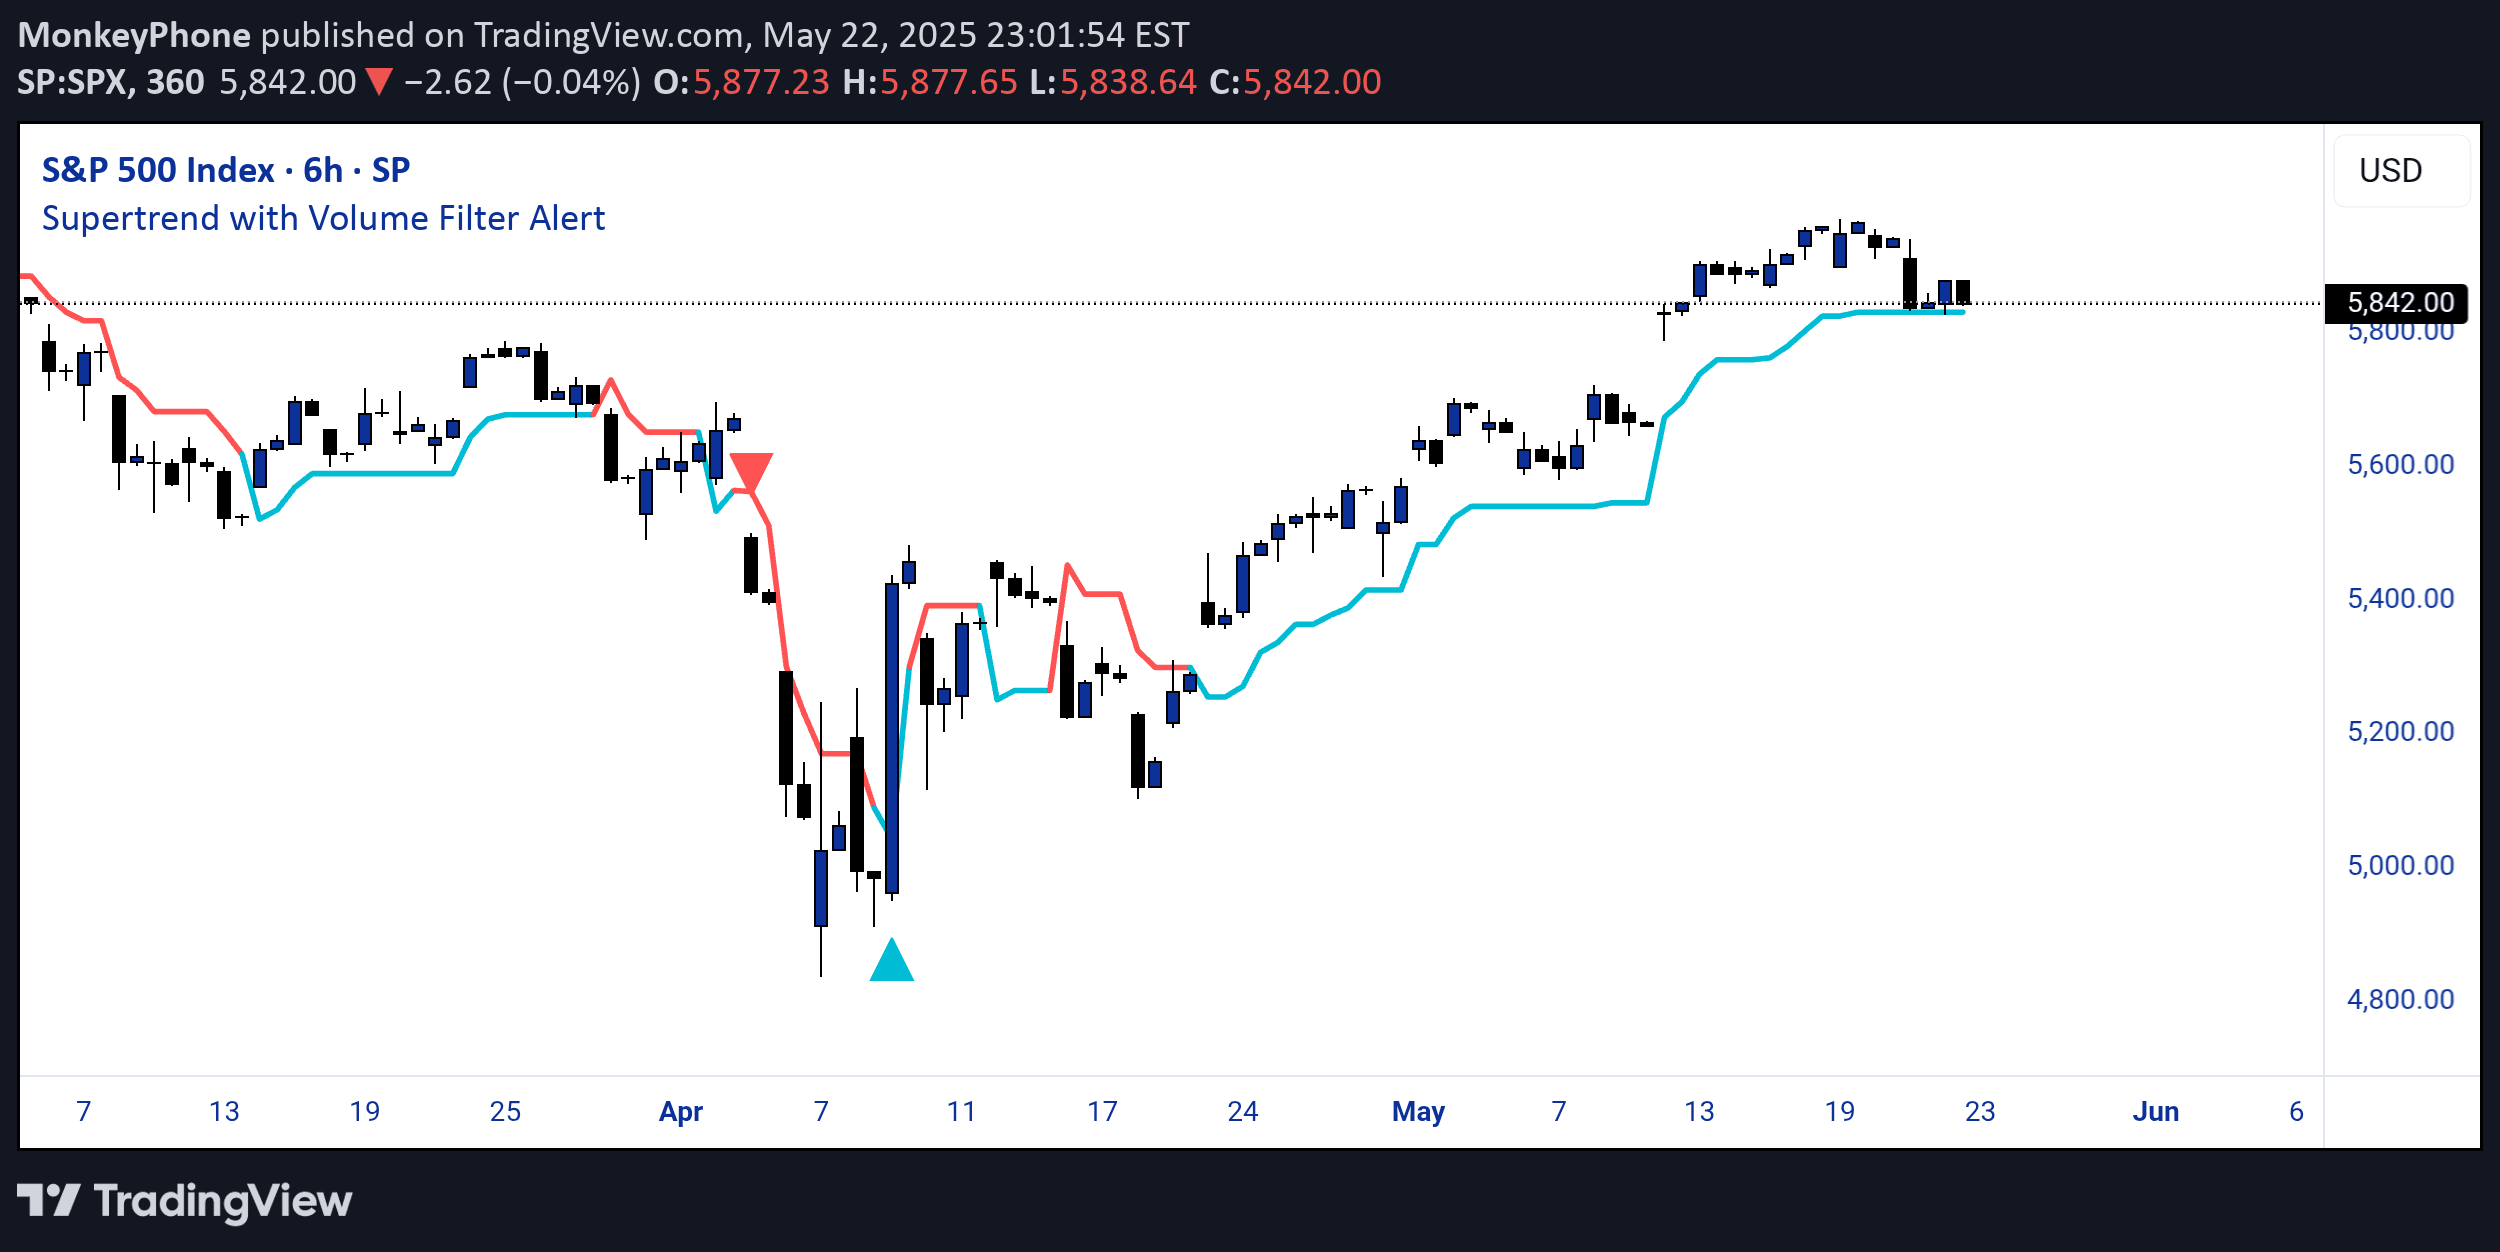
A smart-money trading indicator that detects liquidity zones and potential market reversals using volume, volatility, and candlestick patterns for precise entry points.
Explore complementary indicator rolesHow it works
The Liquidity Zones Alerts indicator operates by analyzing market structure and institutional trading behaviors to identify potential price reversals. It focuses on detecting liquidity sweeps, where price momentarily breaks previous daily or weekly highs/lows, suggesting potential stop hunts or engineered moves by large market participants.
The system employs multiple filters including volume analysis and volatility assessment to validate signals. It looks for high-volume candles, unusual price movements, and confirmation through engulfing candlestick patterns to increase the reliability of potential trade entries.
Why it may be useful
This indicator provides traders with insights into institutional trading dynamics, revealing hidden market intentions that are often invisible to retail traders. By highlighting liquidity zones and potential reversal points, it helps traders understand the underlying market mechanics and make more informed trading decisions.
The sophisticated approach of tracking smart money movements allows traders to anticipate potential price actions before they fully develop. This gives traders a strategic advantage by identifying high-probability entry points and understanding the complex interplay of market forces.
When to explore it
The Liquidity Zones Alerts indicator is most effective in markets with clear institutional participation and significant volume, such as major forex pairs, stock indices, and cryptocurrencies. It performs best during periods of increased market volatility where institutional players are actively managing their positions.
Traders should use this indicator in conjunction with other technical analysis tools and their existing trading strategy. It is particularly useful for identifying potential trend reversals, breakout opportunities, and understanding the hidden liquidity dynamics that drive market movements.
Keep exploring
What we’ve verified
Access, alerts and repainting behaviour have not been independently verified for this indicator. Check the creator’s current publication and settings.
General descriptions and classifications are recovered research. Verified details above identify the specific checks we have completed. Check the creator’s current publication for later changes.