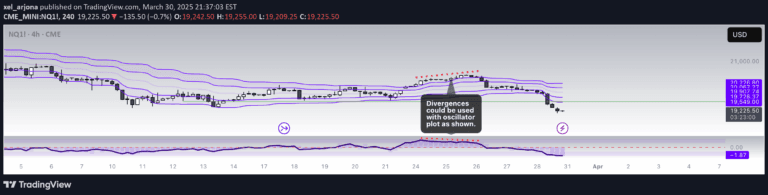
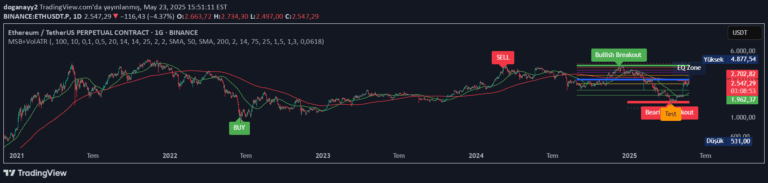
A trading indicator that identifies potential market opportunities by analyzing price range, volume, and their relationship using custom multipliers and ATR calculations.
Explore complementary indicator rolesHow it works
The Liquidity Spotter indicator operates by calculating the Average True Range (ATR) and analyzing volume dynamics to identify unique trading conditions. It uses input variables like ATR length, volume multiplier, and range multiplier to compare current bar characteristics against historical averages.
The script generates specific conditions by examining the relationship between current price range, volume, and their respective historical averages. When these predefined conditions align, the indicator highlights price bars, signaling potential trading opportunities through visual cues on the price chart.
Why it may be useful
Traders benefit from this indicator by gaining insights into market liquidity and potential price movement opportunities that might not be immediately apparent through traditional analysis methods. The tool provides a quantitative approach to identifying unique market conditions by integrating multiple analytical factors simultaneously.
By combining range, volume, and ratio calculations, the indicator offers a comprehensive view of market dynamics. This multi-dimensional analysis helps traders recognize potential entry or exit points that could indicate increased market activity or potential trend changes.
When to explore it
The Liquidity Spotter is most effective in markets with significant price movements and notable volume fluctuations. It works best in highly liquid markets where price ranges and trading volumes provide meaningful insights into potential trading opportunities. Traders should consider using this indicator during periods of increased market activity.
Ideal application includes volatile market sessions, such as during major economic announcements, earnings releases, or significant geopolitical events. The indicator is particularly useful for traders seeking to identify potential breakout or trend reversal moments based on comprehensive market condition analysis.
Keep exploring
What we’ve verified
Access, alerts and repainting behaviour have not been independently verified for this indicator. Check the creator’s current publication and settings.
General descriptions and classifications are recovered research. Verified details above identify the specific checks we have completed. Check the creator’s current publication for later changes.