
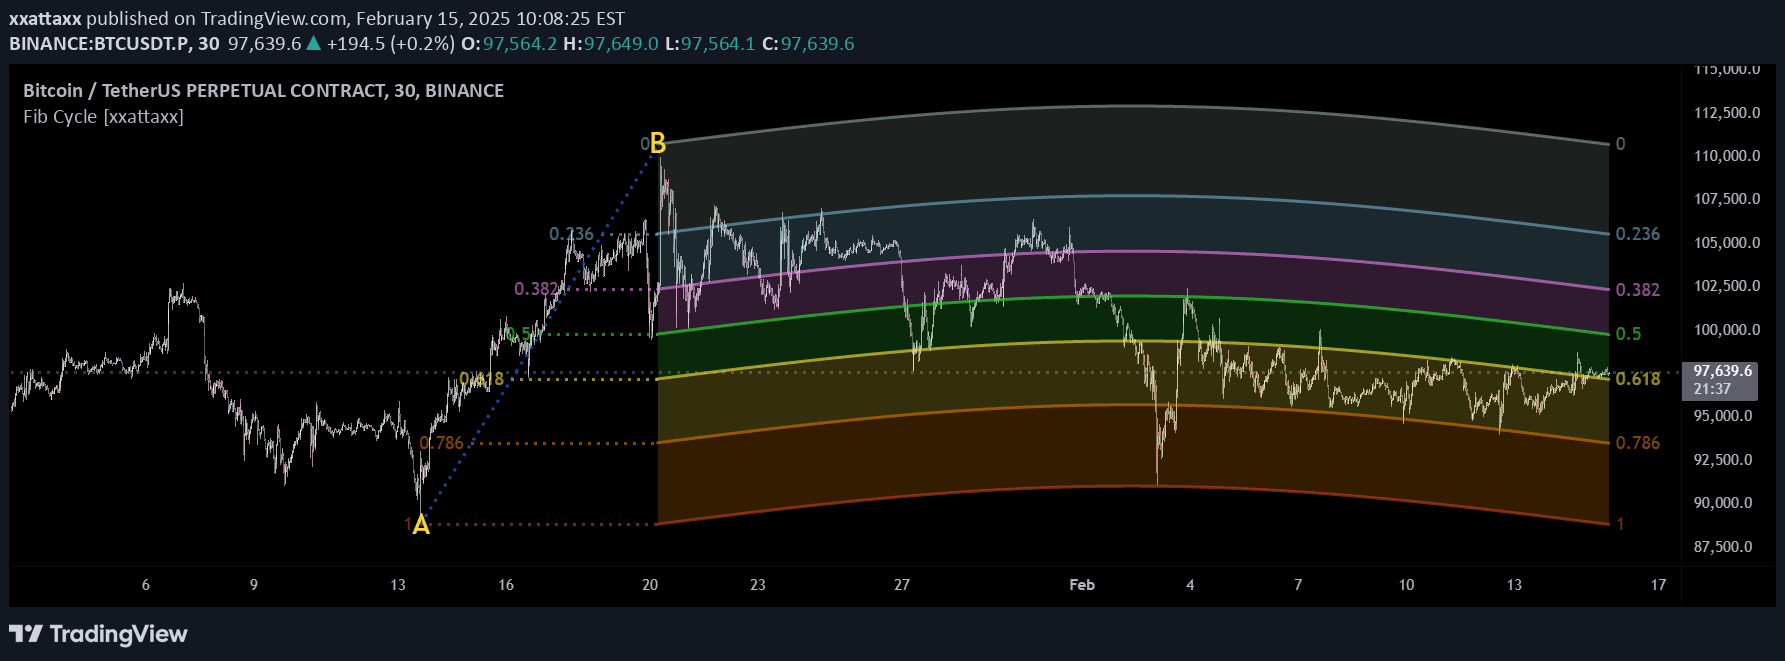
A dynamic Fibonacci analysis tool that transforms traditional retracement levels into wave-based cycles, offering a non-linear approach to understanding market structure and price movements.
Explore complementary indicator rolesHow it works
The Fibonacci Cycle Finder operates by establishing two swing points (A and B) and generating a dynamic wave projection using trigonometric principles. It applies adjustable parameters of wavelength, amplitude, and phase to create a flexible Fibonacci wave that adapts to price action. The indicator starts with minimal curvature, preserving the structural familiarity of traditional Fibonacci retracements.
As users modify the parameters, the wave transitions from a horizontal line to a more pronounced cyclical structure, revealing potential market rhythms. The tool calculates Fibonacci levels along this wave, allowing traders to visualize how price might interact with these dynamically projected zones.
Why it may be useful
Traditional Fibonacci tools often rely on static horizontal levels, which can miss the nuanced cyclical nature of market movements. The Fibonacci Cycle Finder bridges this gap by introducing a wave-based methodology that captures the inherent rhythmic patterns in price action. By applying trigonometric principles, the indicator provides a more flexible and adaptive approach to understanding market structure.
This innovative approach encourages traders to explore Fibonacci relationships beyond rigid retracements, offering deeper insights into potential support, resistance, and market cycle dynamics. It transforms Fibonacci analysis from a rigid, linear concept into a more organic, responsive tool for market interpretation.
When to explore it
The Fibonacci Cycle Finder is most effective in markets with clear trending characteristics and discernible swing points. It works exceptionally well in timeframes that allow for more pronounced wave patterns, such as daily, 4-hour, and weekly charts where longer-term market cycles become more apparent. Traders can benefit from this tool when seeking to understand potential reversal zones or predict market rhythm.
The indicator is particularly useful during periods of market consolidation or when attempting to identify potential trend continuation or reversal points. By providing a non-linear visualization of Fibonacci levels, it offers traders an additional layer of analysis that complements traditional technical indicators and price action strategies.
Keep exploring
What we’ve verified
Access, alerts and repainting behaviour have not been independently verified for this indicator. Check the creator’s current publication and settings.
General descriptions and classifications are recovered research. Verified details above identify the specific checks we have completed. Check the creator’s current publication for later changes.


