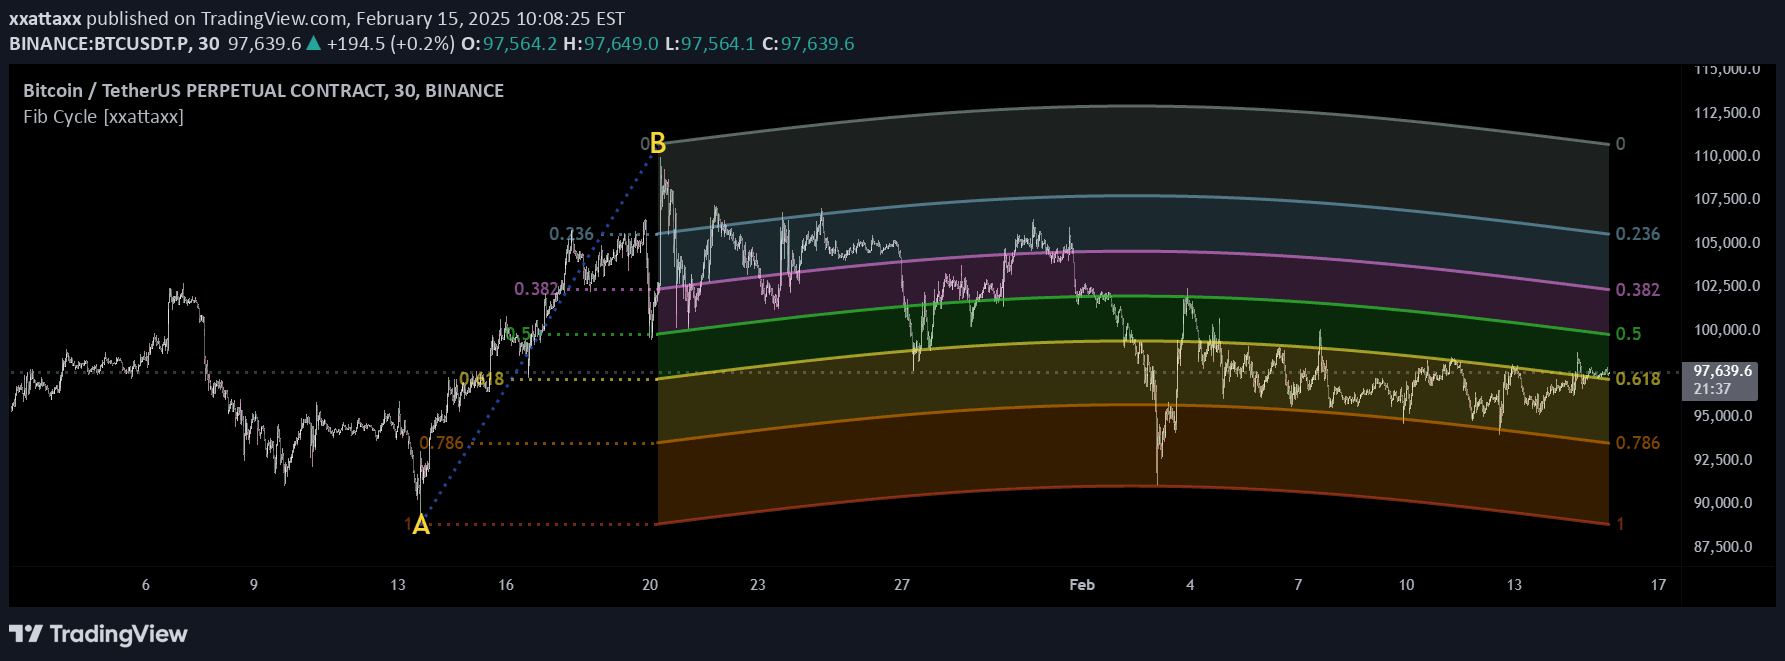
Advanced Fibonacci trading tool designed to help traders identify precise market movements and trend directions using customizable reference periods and levels.
Explore complementary indicator rolesHow it works
The Ultimate Fibonacci Trading Tool automatically detects optimal reference periods by analyzing chart timeframes and selecting higher-resolution periods for more accurate analysis. It calculates Fibonacci levels dynamically, allowing traders to toggle specific percentage levels and customize their visual representation on the chart.
The tool employs advanced algorithms to detect market trends, automatically identifying bullish or bearish conditions and adjusting Fibonacci calculations accordingly. Traders can manually override settings, choose specific timeframe multipliers, and define custom level values to suit their individual trading strategies.
Why it may be useful
Fibonacci analysis provides traders with critical insights into potential support and resistance levels, helping them make more informed trading decisions by identifying key price retracements and extensions. By leveraging higher reference periods, traders can uncover deeper market movements that might be obscured in shorter timeframes.
The tool's flexibility allows traders to personalize their analysis, adapting to different market conditions and individual trading styles. Its automated trend detection and customizable settings reduce manual analysis time and provide a more systematic approach to technical trading.
When to explore it
The Ultimate Fibonacci Trading Tool is most effective during trending markets where clear directional movements are present, helping traders identify potential entry and exit points with greater precision. It works exceptionally well in markets with established momentum, where Fibonacci retracements can provide meaningful insights into potential price reversals.
Traders should utilize this tool when seeking to validate existing trend directions, confirm potential support and resistance levels, and develop more strategic trading approaches. It is particularly useful for traders who want to incorporate a systematic, data-driven method of analyzing market dynamics across multiple timeframes.
Keep exploring
What we’ve verified
Access, alerts and repainting behaviour have not been independently verified for this indicator. Check the creator’s current publication and settings.
General descriptions and classifications are recovered research. Verified details above identify the specific checks we have completed. Check the creator’s current publication for later changes.