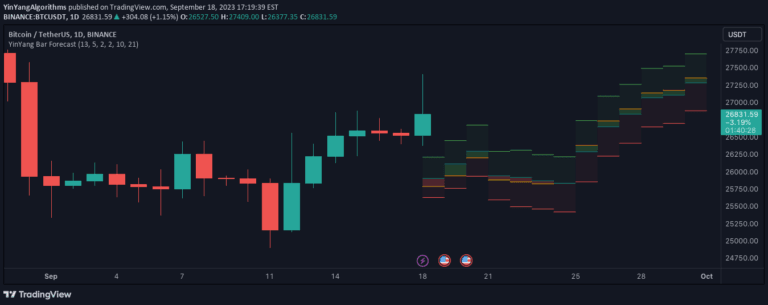
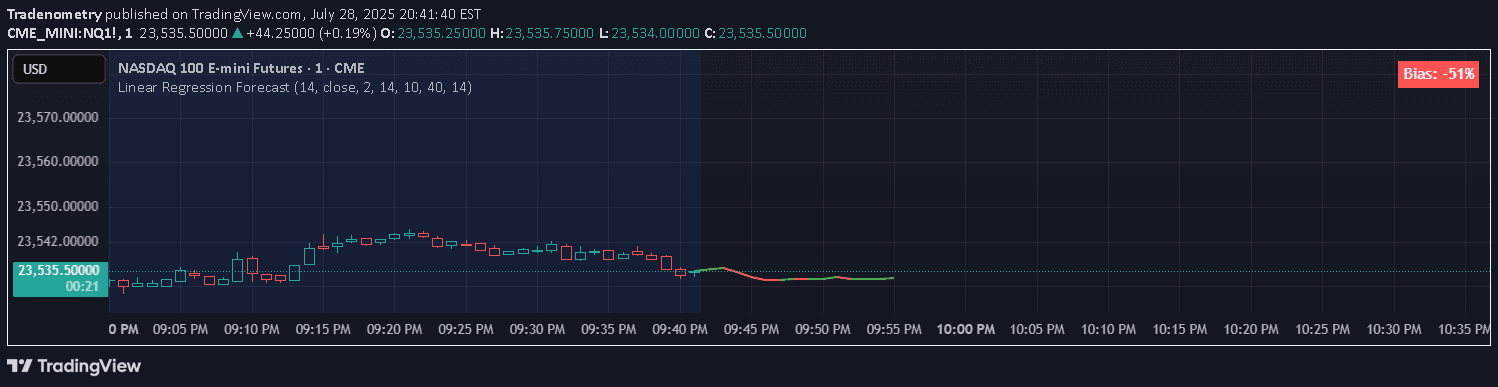
A price projection tool that draws smoothed tangent lines to visually forecast short-term price direction based on recent price movements and calculated slopes.
Explore complementary indicator rolesHow it works
The Tangent Extrapolation Forecast operates by analyzing a specified number of historical bars and calculating their slope over a smoothing window. For each bar within the lookback period, it determines the price movement's directional trajectory using a predefined smoothing technique.
The indicator then extends these calculated slopes forward, creating a visual projection of potential price movement. Each extrapolated line is connected to form a polyline forecast, with color-coding (green, red, gray) indicating the directional nature of the projected price movement.
Why it may be useful
This indicator provides traders with a visual representation of short-term price momentum and potential trend continuation without introducing artificial future gaps. By smoothing and extrapolating recent price movements, it offers insights into potential price trajectories that can help traders anticipate market direction.
The color-coded projection allows quick visual interpretation of potential bullish, bearish, or neutral price movements, enabling traders to make more informed decisions about market sentiment and potential entry or exit points.
When to explore it
The Tangent Extrapolation Forecast is most effective in markets with clear short-term trending characteristics, such as during periods of consistent price movement in stocks, forex, or commodities. Traders can benefit from this tool when seeking to understand immediate price momentum and potential near-term directional shifts.
It is particularly useful for traders focusing on short-term timeframes like intraday and scalping strategies, where quick visual insights into potential price movement can support rapid decision-making. However, traders should combine this tool with other technical and fundamental analysis for comprehensive market assessment.
Keep exploring
What we’ve verified
Access, alerts and repainting behaviour have not been independently verified for this indicator. Check the creator’s current publication and settings.
General descriptions and classifications are recovered research. Verified details above identify the specific checks we have completed. Check the creator’s current publication for later changes.