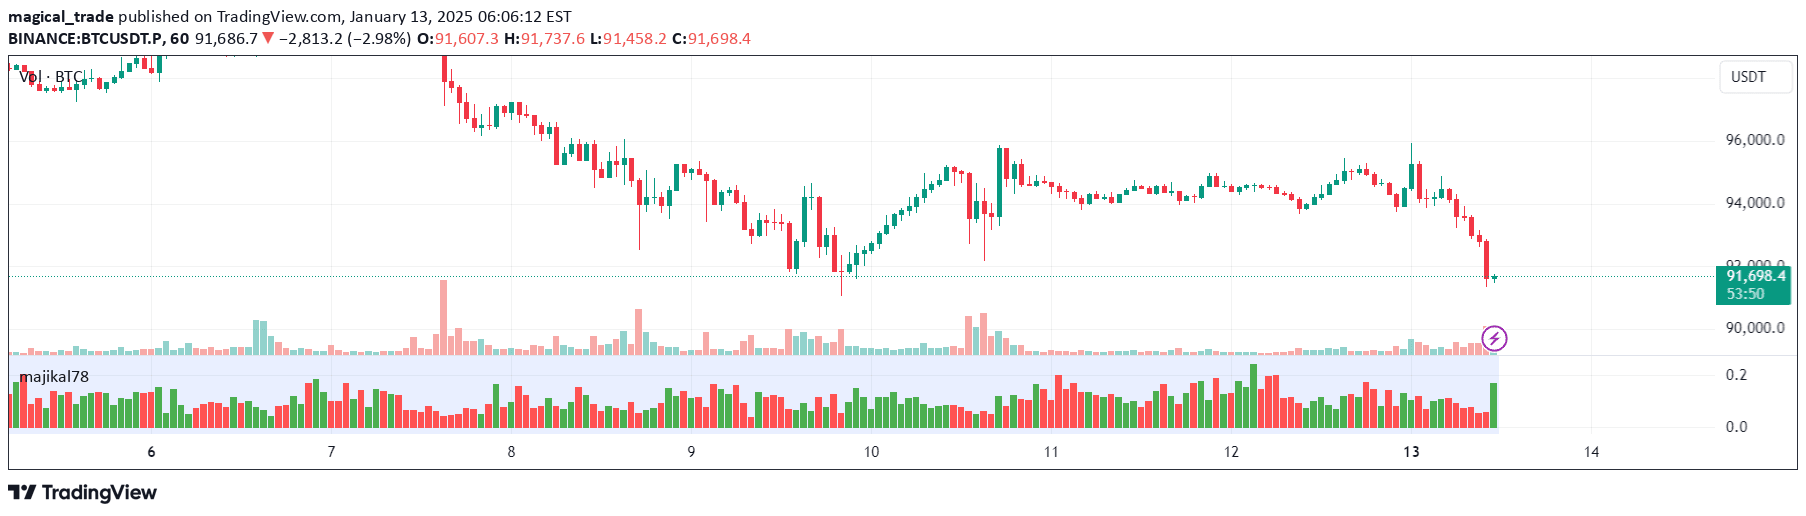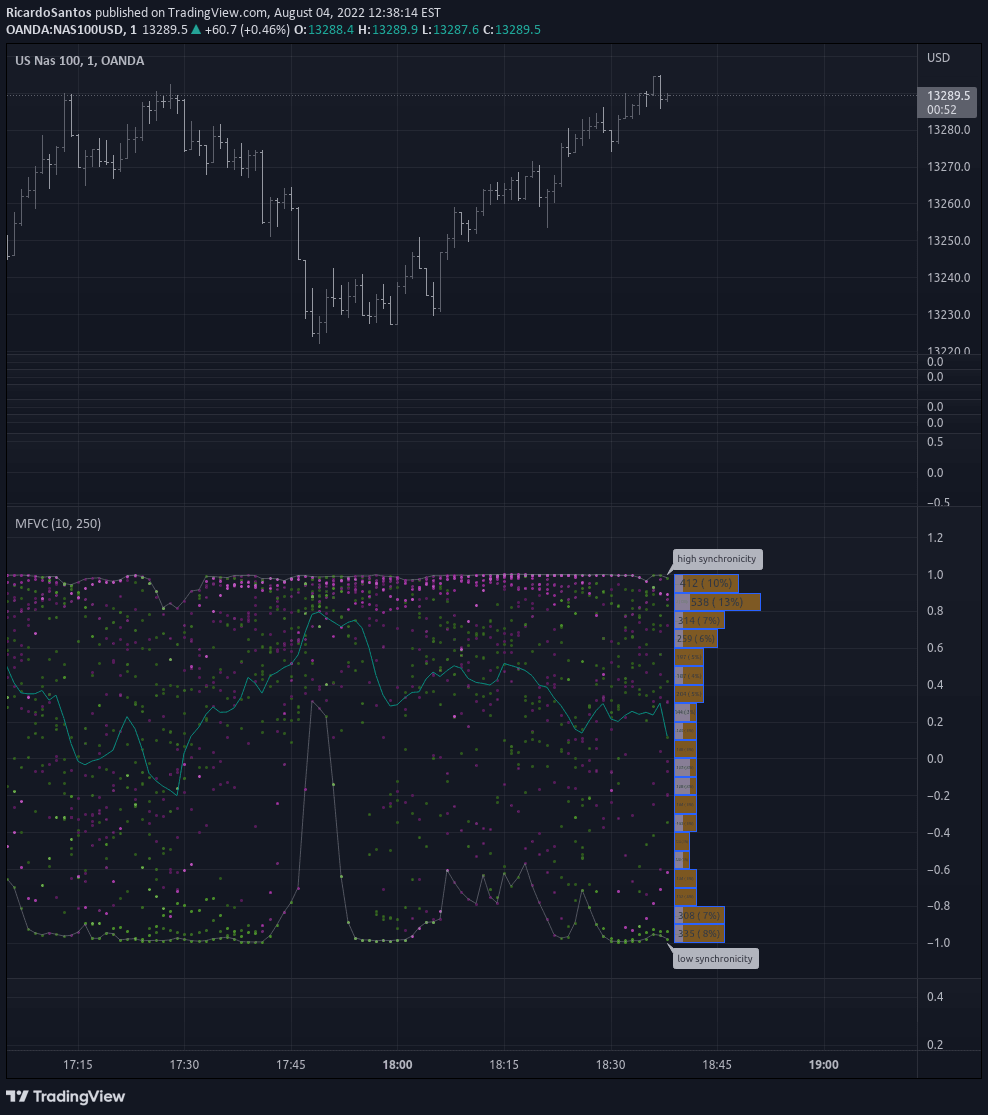
A complex indicator analyzing the relationship between trading volume and price volatility, using color intensity to represent window length and volatility direction.
Explore complementary indicator rolesHow it works
This indicator measures price volatility by correlating volume and price movements across varying window lengths from 2 to 512 periods. It generates visual representations using color coding, with green indicating rising volatility and purple showing falling volatility.
The intensity of the color represents the length of the window used, with darker colors signifying shorter time frames and lighter colors representing longer periods. By tracking these dynamic changes, traders can identify potential shifts in market momentum and volatility patterns
Why it may be useful
Understanding volatility is crucial for traders as it provides insights into market sentiment and potential price movements. This indicator helps traders gauge market uncertainty by visually mapping the relationship between volume and price fluctuations.
By distinguishing between rising and falling volatility, traders can make more informed decisions about potential trend changes, entry and exit points, and risk management strategies. The color-coded visualization makes complex market dynamics more accessible and interpretable
When to explore it
This indicator is most effective during periods of market transition or uncertainty, such as around major economic announcements, earnings reports, or significant geopolitical events. It works best in markets with moderate to high trading volumes where volume and price movements are more predictable.
Traders should use this signal in conjunction with other technical indicators to confirm signals and reduce false positives. It is particularly useful for day traders and swing traders looking to capture short to medium-term market movements
Keep exploring
What we’ve verified
Access, alerts and repainting behaviour have not been independently verified for this indicator. Check the creator’s current publication and settings.
General descriptions and classifications are recovered research. Verified details above identify the specific checks we have completed. Check the creator’s current publication for later changes.