A custom volume ratio indicator that calculates the relationship between price range and trading volume, providing insights into market dynamics and potential trading opportunities.
Explore complementary indicator rolesHow it works
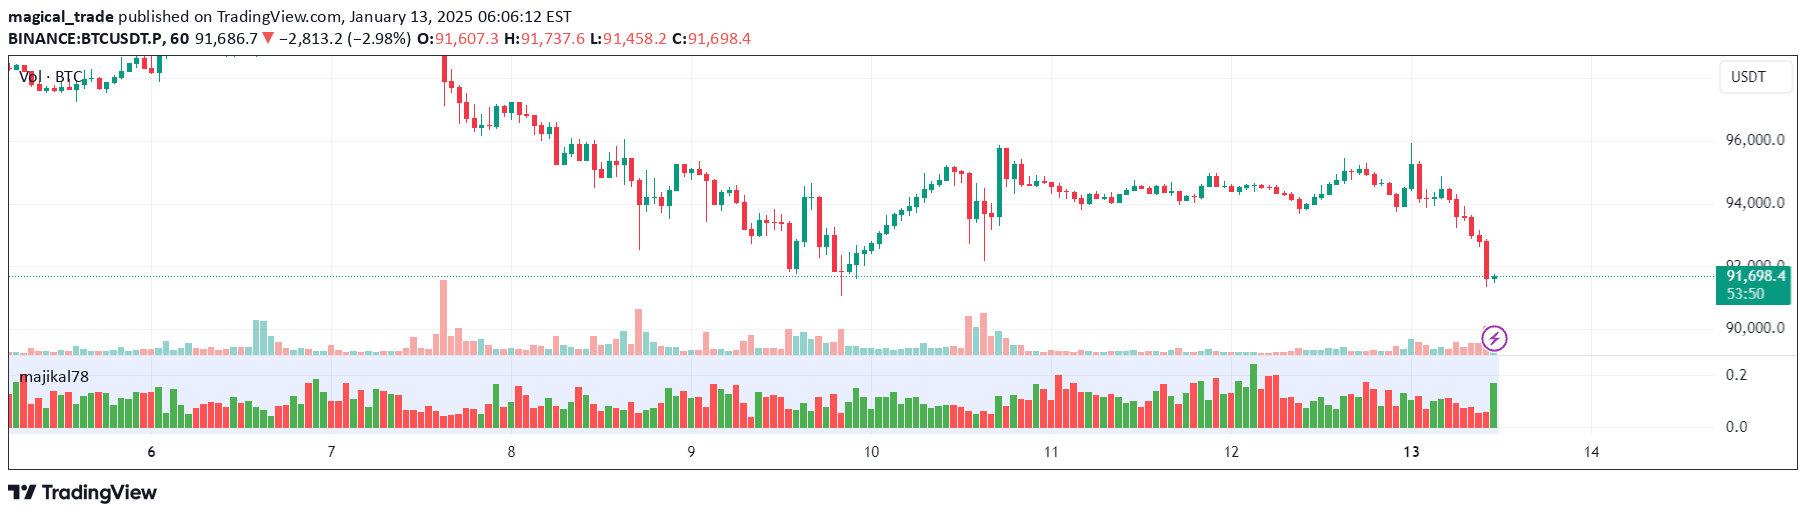
The Custom Volume Ratio Indicator calculates the ratio between a candle's price range and its trading volume by subtracting the lowest price from the highest price and comparing it to the total volume traded. This process creates a visual representation that shows how price movement relates to trading activity, with each bar representing the specific ratio for that time period.
The indicator uses color-coding to enhance interpretation, with green bars indicating bullish candles and red bars representing bearish candles. By presenting this ratio graphically, traders can quickly assess the relationship between price fluctuations and trading volume, making it easier to identify potential market opportunities and understand underlying trading dynamics.
Why it may be useful
The Custom Volume Ratio Indicator provides traders with a unique perspective on market behavior by revealing the connection between price movements and trading volume. By quantifying how much price fluctuates relative to the volume traded, traders can gain deeper insights into market sentiment and potential trend strength that might not be immediately apparent from price charts alone.
This indicator helps traders make more informed decisions by offering a nuanced view of market dynamics. It allows for better understanding of volatility, trend confirmation, and potential trading opportunities by presenting a visual representation of how price ranges correspond with trading volume across different market conditions.
When to explore it
The Custom Volume Ratio Indicator is most effective during periods of significant market activity where understanding the relationship between price movement and trading volume is crucial. Traders can utilize this indicator during trending markets, potential trend reversals, and when assessing the strength of current market momentum.
It is particularly useful in volatile markets where traders need to quickly evaluate the reliability of price movements. The indicator can help identify potential entry and exit points by providing insights into whether price changes are supported by substantial trading volume, making it a valuable tool for traders across different timeframes and market conditions.
Keep exploring
What we’ve verified
Access, alerts and repainting behaviour have not been independently verified for this indicator. Check the creator’s current publication and settings.
General descriptions and classifications are recovered research. Verified details above identify the specific checks we have completed. Check the creator’s current publication for later changes.