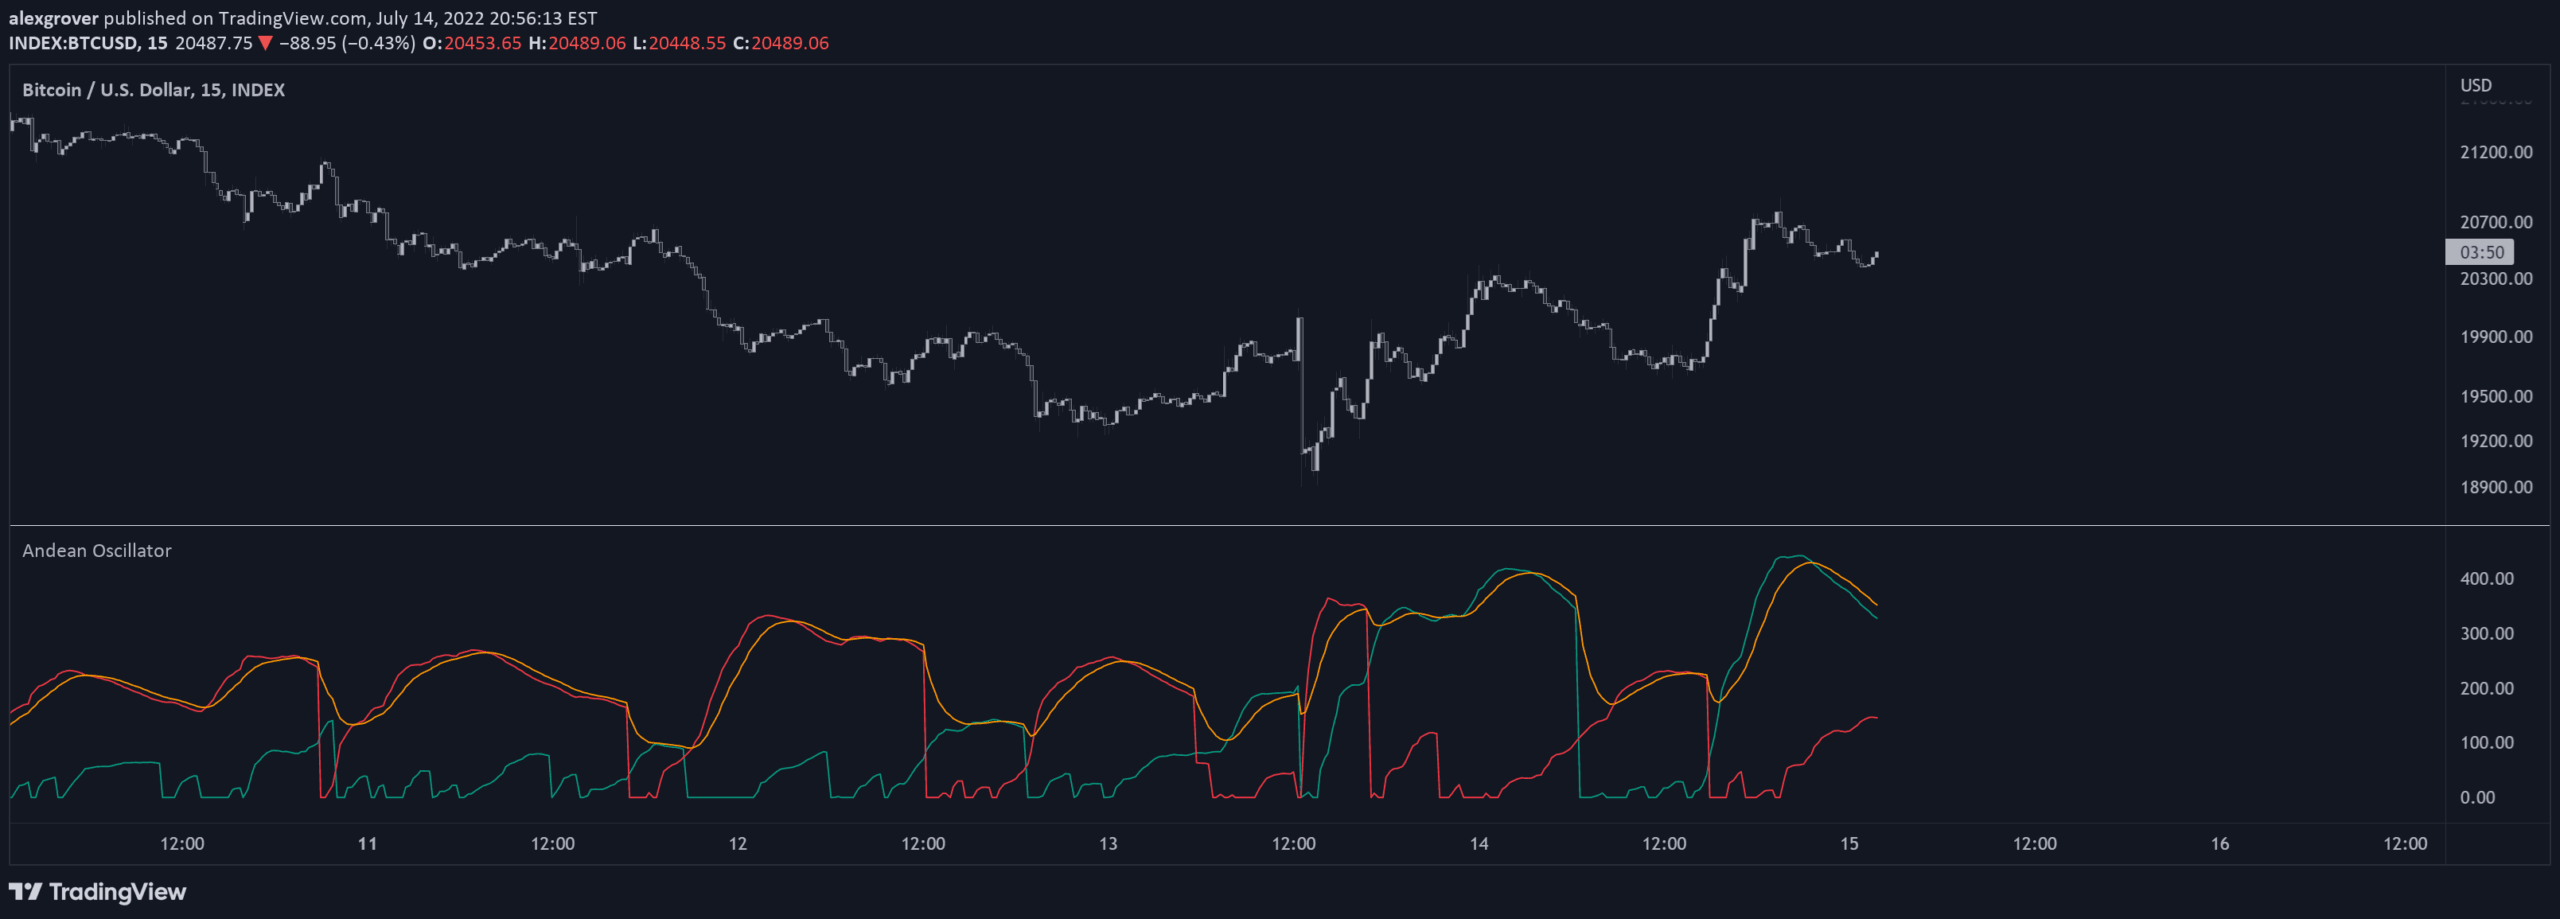
The Andean Oscillator is a trend analysis indicator that measures price variations by comparing bullish and bearish components to identify market direction and potential trend shifts.
Explore complementary indicator rolesHow it works
The Andean Oscillator uses exponential envelopes and standard deviation calculations to generate bullish and bearish components. It creates upper and lower extremities from both regular and squared prices.
The bullish component is calculated by subtracting the upper extremity of squared prices from the squared upper extremity of regular prices, then taking the square root. The bearish component follows a similar process using lower extremities. A signal line is added to help filter potential false signals and provide additional trend confirmation
Why it may be useful
This indicator helps traders understand market dynamics by providing a clear visual representation of trend strength and direction. By separating price variations into bullish and bearish components, it offers insights into potential market movements.
The signal line adds an extra layer of analysis, helping traders filter out noise and make more informed trading decisions. It can be particularly useful for identifying trend reversals and confirming the current market sentiment
When to explore it
The Andean Oscillator works best in trending markets with clear directional movements. It is most effective when used on timeframes that capture medium-term price trends, such as daily or 4-hour charts.
Traders should combine this indicator with other technical analysis tools to validate signals. It can be particularly useful during periods of market volatility when trend identification becomes crucial. The indicator is most reliable when used across different market conditions and asset classes
Keep exploring
What we’ve verified
Access, alerts and repainting behaviour have not been independently verified for this indicator. Check the creator’s current publication and settings.
General descriptions and classifications are recovered research. Verified details above identify the specific checks we have completed. Check the creator’s current publication for later changes.