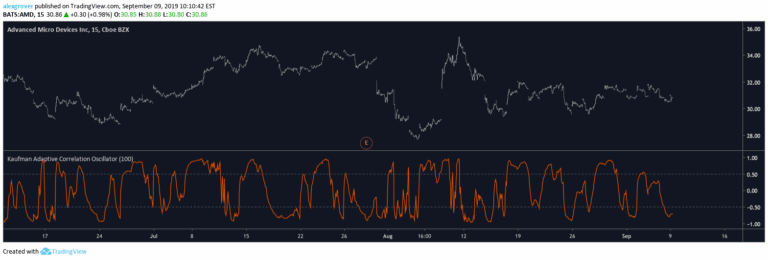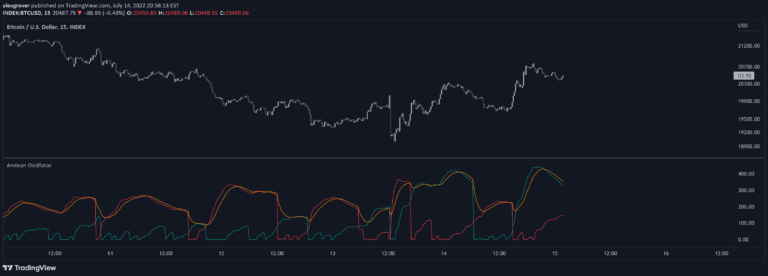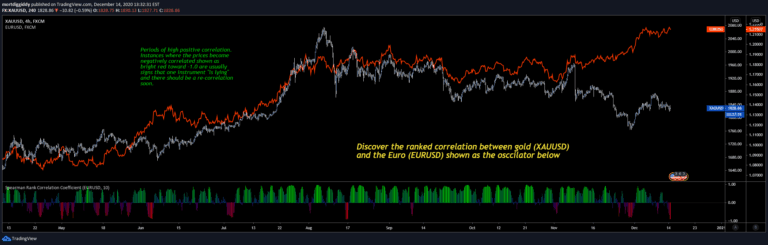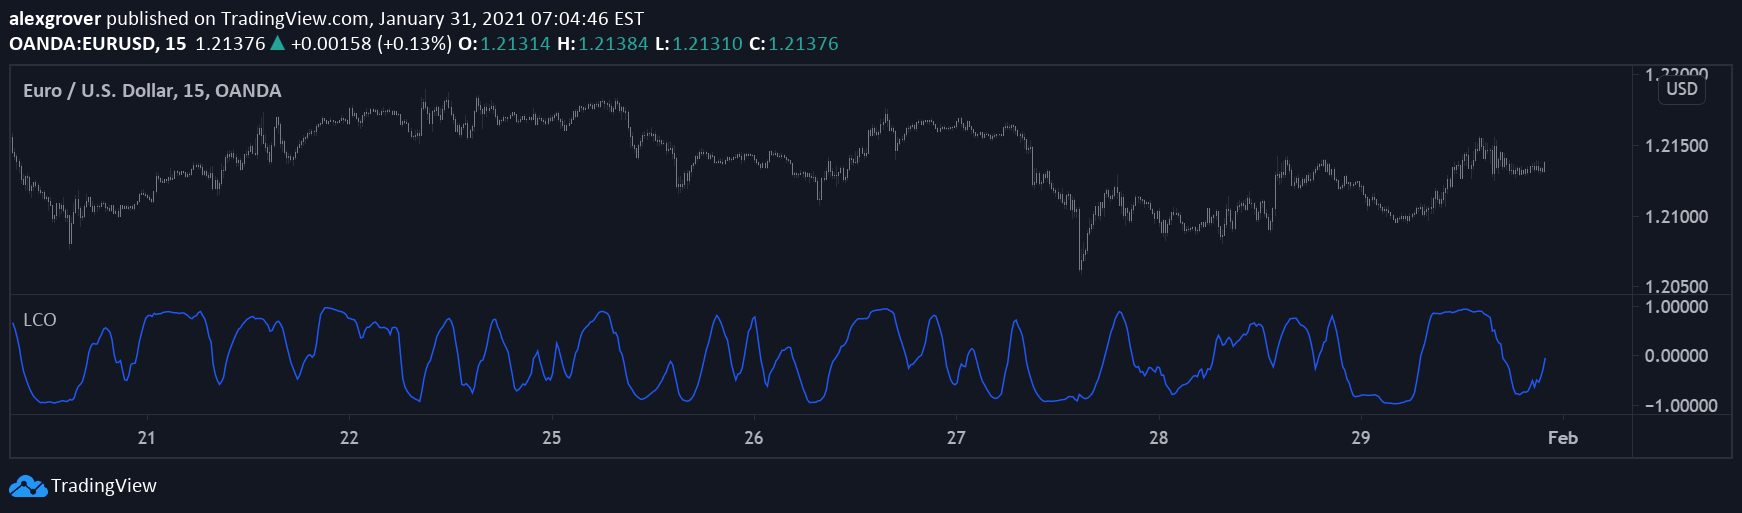
A technique for computing rolling correlation between an input series and linear sequence, providing insights into trend dynamics and regression analysis using moving average techniques.
Explore complementary indicator rolesHow it works
This signal computes rolling correlation by comparing a weighted moving average (WMA) with a simple moving average (SMA) of an input series. It leverages normalized difference calculations and closed-form solutions for moving averages and standard deviations.
The method efficiently calculates rolling R-Squared and sum of squared errors (SSE) using cumulative sum techniques. By analyzing the correlation between a linear sequence and price data, traders can identify underlying trend characteristics. The approach provides a mathematical framework for understanding price movement patterns without requiring complex looping algorithms
Why it may be useful
Rolling correlation analysis offers traders a sophisticated mathematical approach to understanding market dynamics. It provides insights into trend strength and direction by quantifying the relationship between price movements and linear sequences.
The method allows for efficient computation of statistical metrics like R-Squared, which can help assess the reliability of trend predictions. By leveraging normalized differences and cumulative sum techniques, traders can gain a more nuanced understanding of price behavior. This approach enables more precise trend identification and potential trend reversal signals
When to explore it
This signal works best in markets with clear directional trends and relatively stable price movements. It is particularly useful for swing traders and day traders seeking to identify trend strength and potential momentum shifts. The technique is most effective when applied to liquid markets with sufficient price data for meaningful statistical analysis.
Traders should use this signal in conjunction with other technical indicators to confirm trend signals. It can be particularly valuable when examining medium-term price trends across various financial instruments, including stocks, forex, and cryptocurrency markets
Keep exploring
What we’ve verified
Access, alerts and repainting behaviour have not been independently verified for this indicator. Check the creator’s current publication and settings.
General descriptions and classifications are recovered research. Verified details above identify the specific checks we have completed. Check the creator’s current publication for later changes.