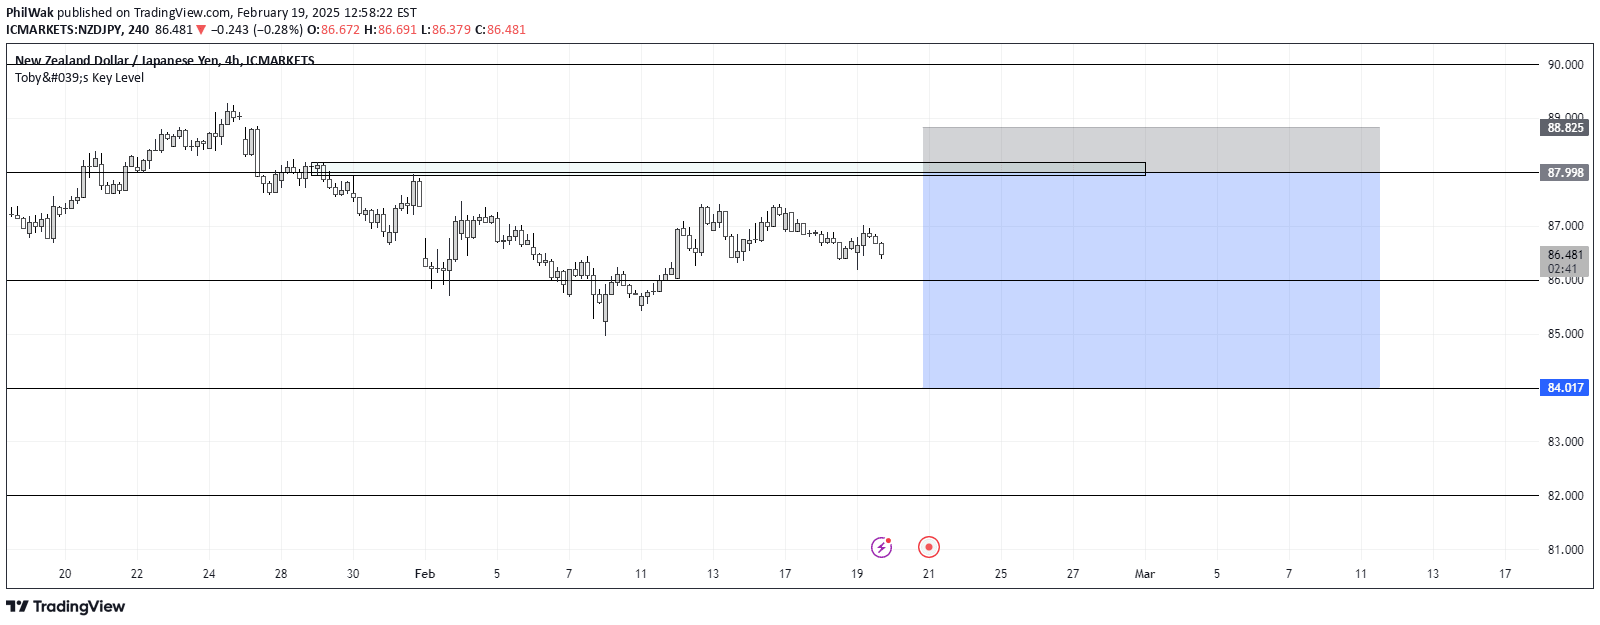
RexDog Key Levels indicator plots weekly and daily open prices, vWAP, and critical market zones to help traders identify high-probability reaction areas and trading opportunities.
Explore complementary indicator rolesHow it works
The RexDog Key Levels indicator plots essential price reference points such as weekly open, daily open, and previous day's volume-weighted average price (vWAP). These levels are color-coded to indicate price positioning relative to key zones, with colors changing dynamically based on whether price is above or below these critical levels.
The indicator also includes visual elements like triangles and circles to quickly communicate market positioning. These markers help traders quickly understand price relationship to key levels, with green and red indicators signaling whether price is above or below significant reference points.
Why it may be useful
Key levels are crucial for understanding market dynamics and potential price reactions, acting as psychological and technical pivot points where traders converge. These levels serve as potential support and resistance zones, providing traders with strategic entry and exit points based on market sentiment and price behavior.
By visualizing these levels, traders can develop more informed trading strategies, anticipate potential price movements, and make more precise trading decisions. The indicator helps traders view price levels as dynamic zones of interaction rather than rigid lines, encouraging a more nuanced approach to market analysis.
When to explore it
This indicator is most effective in markets with clear directional movements and when price is approaching key reference levels. Traders should focus on using the indicator during periods of market volatility, when price is likely to exhibit strong reactions at these critical zones.
The RexDog Key Levels are particularly useful for traders looking to identify potential trend reversals, continuation patterns, and high-probability trade setups. It works best when combined with additional confirmation signals and used across multiple timeframes to validate trading decisions.
Keep exploring
What we’ve verified
Access, alerts and repainting behaviour have not been independently verified for this indicator. Check the creator’s current publication and settings.
General descriptions and classifications are recovered research. Verified details above identify the specific checks we have completed. Check the creator’s current publication for later changes.