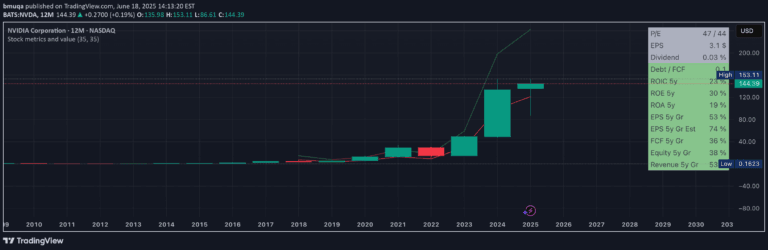
The Shiller PE Ratio is a long-term market valuation indicator that measures stock prices relative to inflation-adjusted 10-year average earnings for the S&P 500.
Explore complementary indicator rolesHow it works
The Shiller PE Ratio calculates a stock's share price divided by its 10-year average, inflation-adjusted earnings. This provides a smoothed, long-term perspective on market valuation by averaging earnings over a decade to reduce short-term economic fluctuations.
By incorporating inflation adjustment, the indicator offers a more normalized view of corporate earnings. The built-in moving average and Bollinger Bands help traders identify potential market over or undervaluation, creating a comprehensive analytical tool for understanding broader market trends.
Why it may be useful
The Shiller PE Ratio provides investors with a sophisticated method to assess market valuation beyond traditional price-to-earnings metrics. It helps identify potential market bubbles or undervalued conditions by offering a more comprehensive, long-term perspective on stock prices relative to corporate earnings.
By smoothing out short-term economic noise and accounting for inflation, this indicator allows investors to make more informed decisions about market entry and exit points. It serves as a valuable tool for understanding broader market cycles and potential investment opportunities.
When to explore it
The Shiller PE Ratio is most effective for long-term investors and swing traders looking to understand broader market valuation trends. It works best when analyzing entire market indices like the S&P 500, providing insights into overall market sentiment and potential long-term investment strategies.
Traders should use this indicator during periods of significant market transition or when evaluating potential market peaks and troughs. It is particularly useful for making strategic asset allocation decisions and understanding whether the market might be overvalued or undervalued from a historical perspective.
Keep exploring
What we’ve verified
Access, alerts and repainting behaviour have not been independently verified for this indicator. Check the creator’s current publication and settings.
General descriptions and classifications are recovered research. Verified details above identify the specific checks we have completed. Check the creator’s current publication for later changes.