A performance tracking indicator for long-term investors using dividend reinvestment, calculating yearly returns and visualizing portfolio growth through accumulated shares and investment value.
Explore complementary indicator rolesHow it works
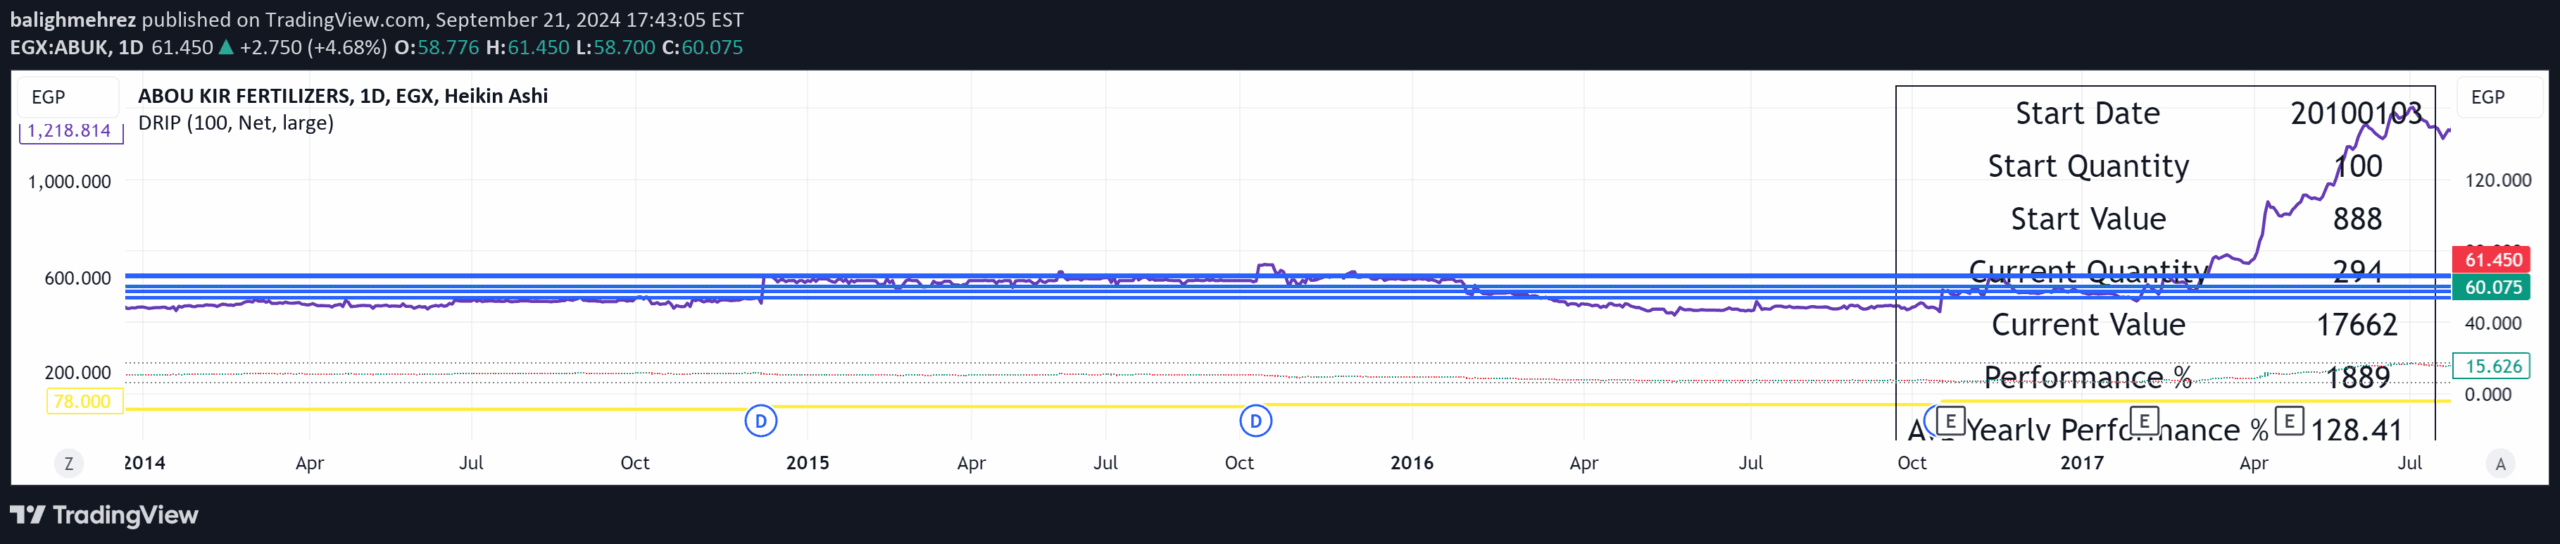
The DRIP Yearly Performance indicator calculates investment returns by tracking dividend reinvestment over time. It starts by allowing users to set an initial quantity of shares and choose a custom start date for performance analysis.
The script automatically adjusts the number of units held by reinvesting dividends, creating a comprehensive view of portfolio growth. It calculates total performance percentage and average yearly performance, presenting these metrics in an easy-to-read table format with customizable visual representations.
Why it may be useful
This indicator provides crucial insights for long-term investors by demonstrating the compounding power of dividend reinvestment. It helps investors understand how consistently reinvesting dividends can significantly enhance portfolio value over time.
By offering detailed performance tracking, the indicator enables investors to make informed decisions about their investment strategies. It transforms abstract dividend reinvestment concepts into clear, visual representations of portfolio growth and potential returns.
When to explore it
The DRIP Yearly Performance indicator is most effective for investors with a long-term investment horizon, particularly those focused on dividend growth strategies. It is ideal for analyzing investments in stable, dividend-paying stocks or funds where consistent reinvestment can create meaningful compounding effects.
Investors can use this tool to evaluate performance from specific historical periods, compare different investment approaches, and understand the true impact of dividend reinvestment on their overall portfolio growth.
Keep exploring
What we’ve verified
Access, alerts and repainting behaviour have not been independently verified for this indicator. Check the creator’s current publication and settings.
General descriptions and classifications are recovered research. Verified details above identify the specific checks we have completed. Check the creator’s current publication for later changes.