Drip's 11am rule breakout/breakdown (OG)
A trading strategy focusing on identifying potential price continuation after 11:30 AM EST, using high/low of day zones and momentum indicators to signal trading opportunities.
Explore 11,183 indicators. Filter beyond the obvious.
Discover the tools that fit the way you trade.
11,183 tools to explore
A trading strategy focusing on identifying potential price continuation after 11:30 AM EST, using high/low of day zones and momentum indicators to signal trading opportunities.
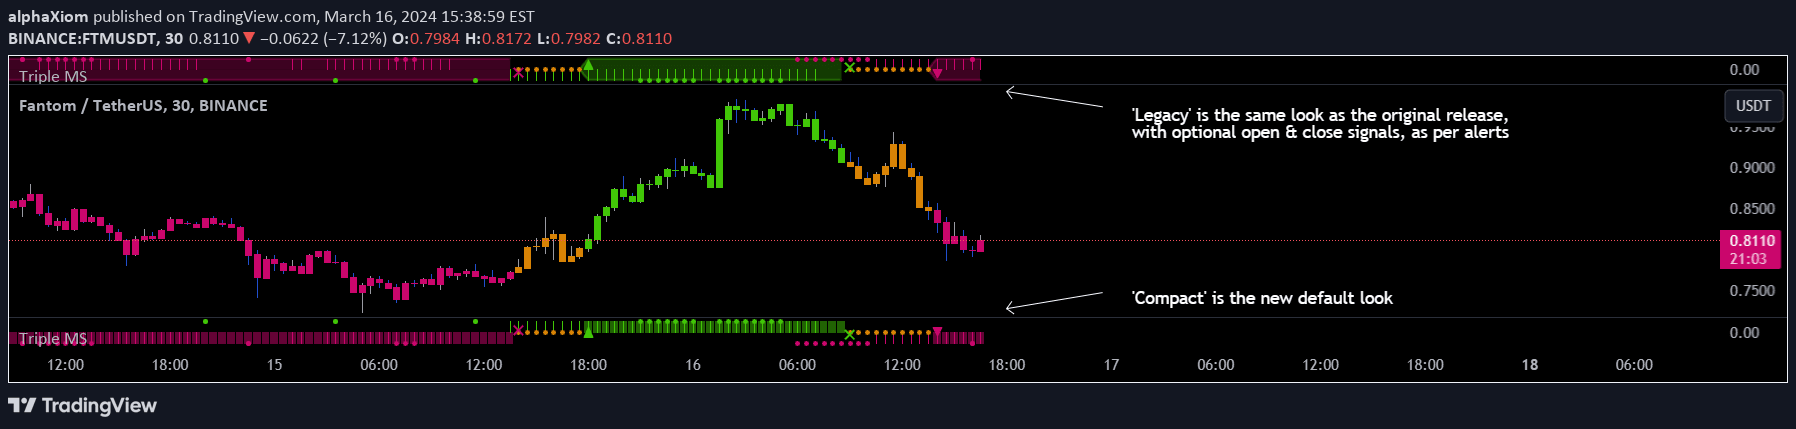
Triple Ehlers Market State is an advanced trend identification indicator that uses three correlation cycles to determine market states with refined bullish, bearish, and trendless signals.
Dynamic Trend Fusion combines MACD and RSI to create an adaptable technical analysis tool that identifies market trends and provides customizable trading insights.
A comprehensive MACD indicator that calculates multiple MACD lines, averages them, and detects market conditions through visual color-coded signals for trend analysis.
MACD Highlight Zones is a visual trading tool that uses color-coded backgrounds to quickly identify market momentum shifts between bullish, bearish, and potential reversal points.
A dynamic trading tool combining daily pivot levels with EMA ribbons to help traders identify market structure, momentum, and key decision zones with visual clarity.
A dynamic trading indicator that identifies Golden Cross and Death Cross patterns with price action confirmation, highlighting potential trend changes through moving average crossovers.
A performance tracking indicator for long-term investors using dividend reinvestment, calculating yearly returns and visualizing portfolio growth through accumulated shares and investment value.
Likes, views, and comments are historical TradingView snapshots. They describe attention, not trading performance.