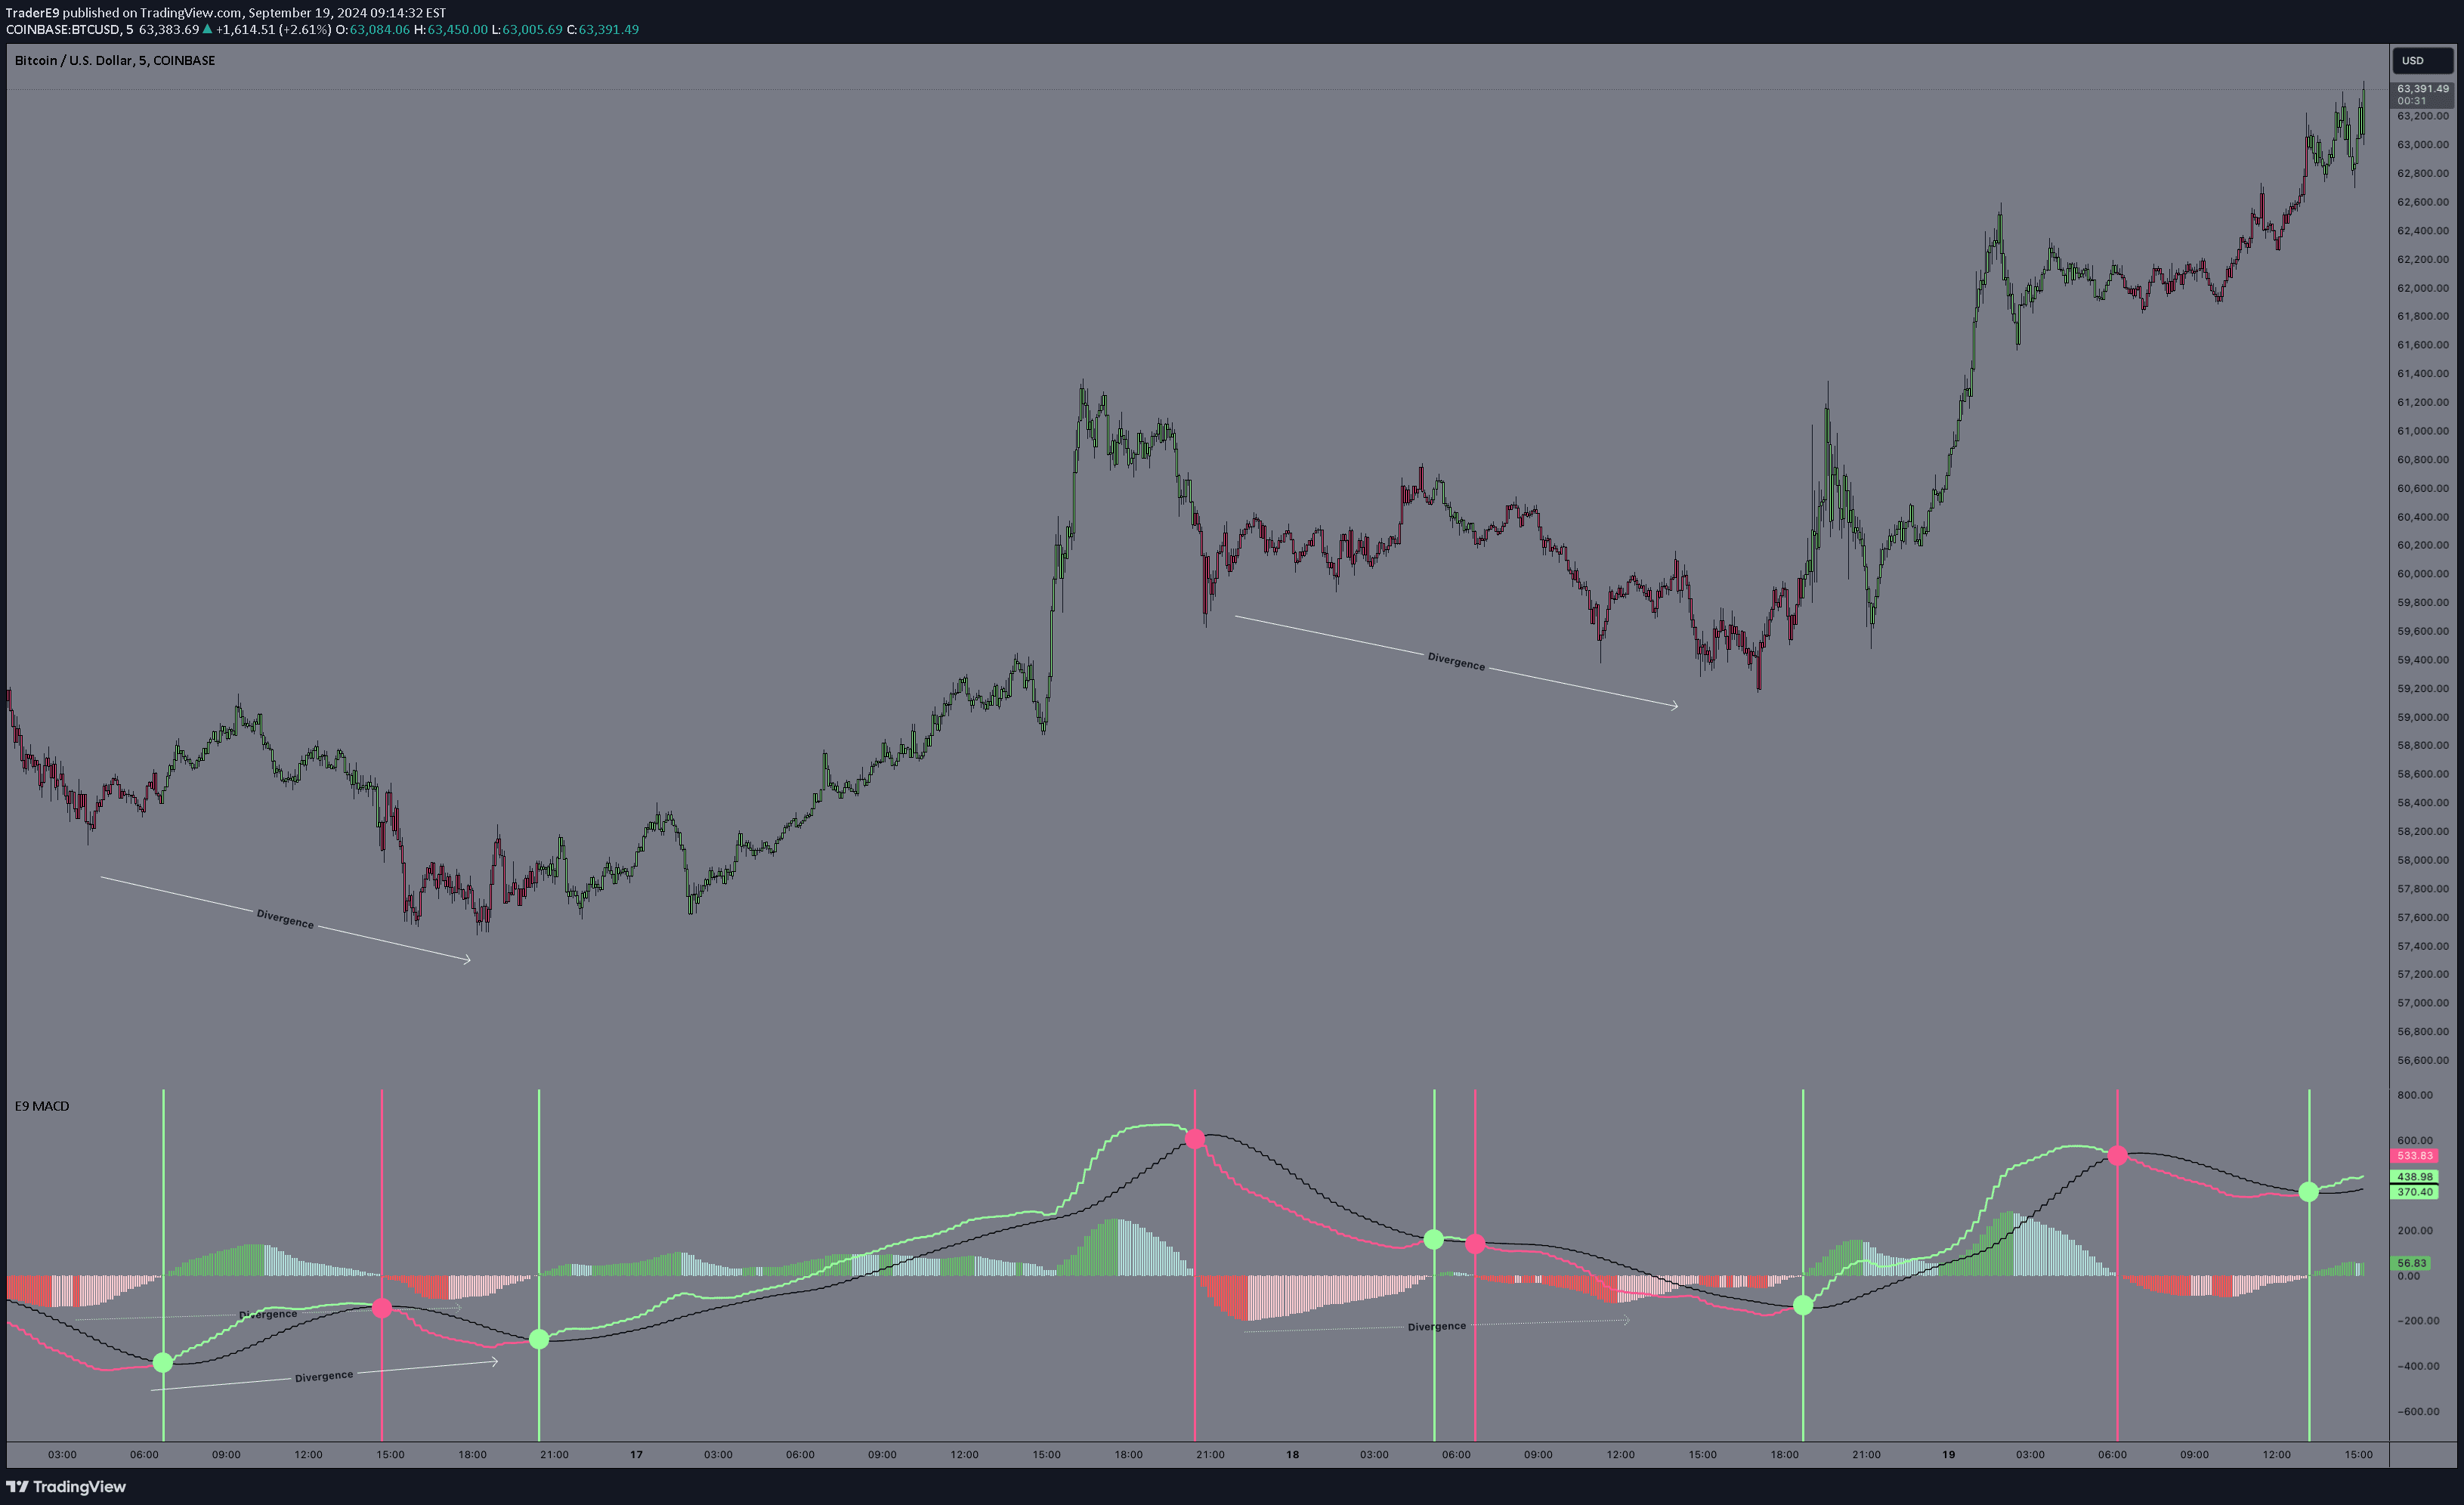
MACD Highlight Zones is a visual trading tool that uses color-coded backgrounds to quickly identify market momentum shifts between bullish, bearish, and potential reversal points.
Explore complementary indicator rolesHow it works
The MACD Highlight Zones script operates by tracking the Moving Average Convergence Divergence (MACD) line's position relative to its zero line and signal line. When the MACD line crosses above zero, the background turns green, indicating bullish momentum and potential buying opportunities. When the MACD line crosses below zero, the background shifts to red, signaling bearish momentum and potential selling scenarios.
The script dynamically changes background colors to provide instant visual feedback about market momentum. When the MACD line crosses the signal line, a yellow background appears, suggesting a potential momentum shift and alerting traders to possible trend changes or interim market transitions.
Why it may be useful
The MACD Highlight Zones provide traders with an intuitive, color-coded method to quickly assess market momentum without complex calculations or manual interpretation. By transforming numerical MACD data into visual signals, traders can rapidly understand market sentiment and make more informed trading decisions with reduced cognitive load.
This approach simplifies technical analysis by offering immediate insights into market dynamics. The color-coded zones help traders identify potential entry and exit points more efficiently, reducing the time needed to analyze charts and enabling faster response to changing market conditions.
When to explore it
The MACD Highlight Zones are most effective in markets with clear trending characteristics, such as stocks, forex, and cryptocurrency markets. Traders should use this tool during periods of moderate to high market volatility, where momentum shifts are more likely to occur and provide meaningful trading signals.
This indicator works best when combined with other technical analysis tools to confirm signals and reduce false positives. Ideal usage includes identifying potential trend reversals, assessing momentum strength, and providing quick visual cues about market sentiment across various timeframes and trading styles.
Keep exploring
What we’ve verified
Access, alerts and repainting behaviour have not been independently verified for this indicator. Check the creator’s current publication and settings.
General descriptions and classifications are recovered research. Verified details above identify the specific checks we have completed. Check the creator’s current publication for later changes.