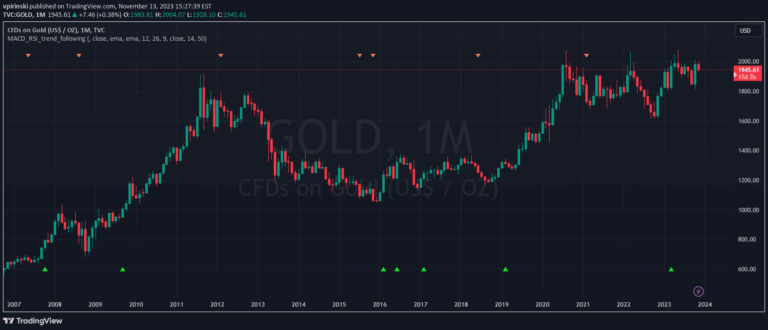
Dynamic Trend Fusion combines MACD and RSI to create an adaptable technical analysis tool that identifies market trends and provides customizable trading insights.
Explore complementary indicator rolesHow it works
The Dynamic Trend Fusion (DTF) indicator integrates Moving Average Convergence Divergence (MACD) and Relative Strength Index (RSI) by first normalizing these indicators to a comparable scale. This normalization allows for a comprehensive assessment of market conditions by blending two powerful technical analysis tools.
After combining the normalized values, DTF applies a smoothing mechanism using a moving average to refine the signal. The resulting composite indicator can then visually represent market states through color-coded line changes, enabling traders to quickly identify transitions between bullish and bearish market conditions.
Why it may be useful
The DTF indicator provides traders with a sophisticated, multi-dimensional view of market dynamics by synthesizing momentum and trend information from two established technical indicators. By combining MACD and RSI, it offers a more nuanced perspective than single-indicator analysis, helping traders make more informed decisions.
Its flexibility in supporting various trading styles - from conservative long-term approaches to aggressive short-term strategies - makes it a versatile tool for diverse trading preferences. The ability to generate timely alerts about market state changes empowers traders to respond quickly to emerging opportunities and potential trend reversals.
When to explore it
The Dynamic Trend Fusion indicator is most effective in markets with clear trending characteristics, where momentum and directional movements are pronounced. It performs exceptionally well in liquid markets with sufficient price action, such as major stock indices, forex pairs, and actively traded commodities.
Traders should consider employing DTF during periods of market volatility, when rapid trend changes are likely, and when seeking a comprehensive view of market momentum. It is particularly useful for traders who value adaptive, customizable tools that can be tailored to different trading timeframes and risk tolerances.
Keep exploring
What we’ve verified
Access, alerts and repainting behaviour have not been independently verified for this indicator. Check the creator’s current publication and settings.
General descriptions and classifications are recovered research. Verified details above identify the specific checks we have completed. Check the creator’s current publication for later changes.