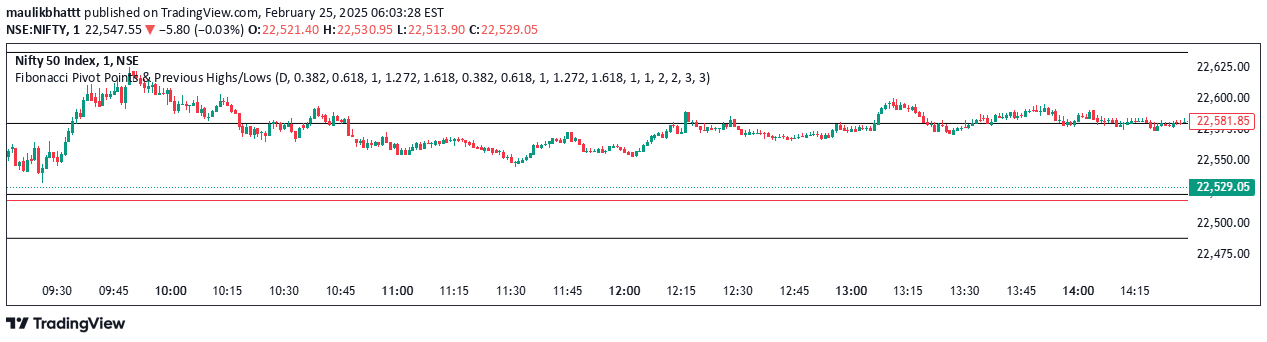
A dual-timeframe indicator that identifies significant price highs and lows across long and short-term periods, helping traders spot potential trend changes and breakout opportunities.
Explore complementary indicator rolesHow it works
The indicator analyzes price data across two distinct timeframes using configurable periods and time units. It calculates the highest highs and lowest lows for both long-term (e.g., weekly) and short-term (e.g., daily) periods, creating a comprehensive view of price extremes.
When a new high or low is detected, the indicator plots triangular markers on the chart to visually highlight these significant price points. Traders can also optionally display channel lines that connect the highest and lowest price levels, providing additional context about the price range and potential trend movements.
Why it may be useful
The dual-timeframe approach allows traders to gain a more nuanced understanding of price dynamics by comparing long-term and short-term trends simultaneously. This comprehensive perspective helps identify potential trend reversals, breakout opportunities, and critical support and resistance levels that might be missed when analyzing a single timeframe.
By providing visual markers for new highs and lows, the indicator offers traders immediate insights into price momentum and potential trend shifts. The optional channel display further enhances traders' ability to interpret market conditions, making complex price action more accessible and easier to understand.
When to explore it
This indicator is most effective when traders want to analyze price trends across multiple timeframes and identify potential trend changes or breakout opportunities. It works particularly well in markets with clear directional movements and when traders are looking to confirm trend strength or detect early signs of trend reversal.
The flexibility of customizable time periods and units makes it adaptable to various trading styles, from short-term scalping to longer-term swing trading. Traders can adjust the settings to match their specific trading strategy, making it a versatile tool for different market conditions and asset classes.
Keep exploring
What we’ve verified
Access, alerts and repainting behaviour have not been independently verified for this indicator. Check the creator’s current publication and settings.
General descriptions and classifications are recovered research. Verified details above identify the specific checks we have completed. Check the creator’s current publication for later changes.