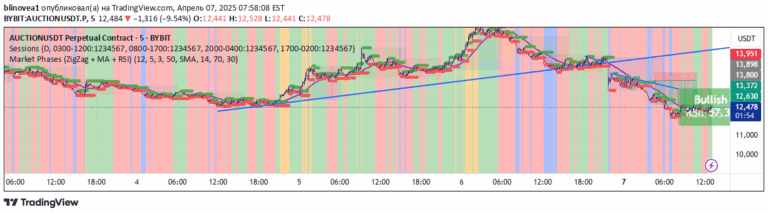
An advanced indicator that identifies equal highs and lows in price movements, helping traders detect potential market trend reversals and consolidation phases.
Explore complementary indicator rolesHow it works
The Equal Highs/Lows indicator analyzes price data to identify moments where high or low price points are equal within a specific range. It uses Average True Range (ATR) as a dynamic threshold to ensure precise level identification, adjusting in real-time to market volatility.
When the indicator detects equal highs or lows, it marks these points on the chart with visual lines and labels. For bearish signals, an Equal High (EQH) is formed, suggesting potential trend reversal, while an Equal Low (EQL) indicates a potential bullish reversal.
Why it may be useful
By highlighting equal highs and lows, this indicator helps traders recognize critical price levels that might signal potential market trend changes. It provides visual confirmation of possible trend reversals, allowing traders to make more informed decisions about entry and exit points.
The dynamic adaptability of the indicator, powered by ATR-based thresholds, ensures that traders can rely on accurate and context-sensitive signals across different market conditions and timeframes.
When to explore it
The Equal Highs/Lows indicator is most effective in markets with clear trending or consolidating price action. It works particularly well in identifying potential reversal points in both bullish and bearish market environments, providing traders with early warning signals.
Traders should use this indicator in conjunction with other technical analysis tools to confirm signals and validate potential trade opportunities. It is especially useful for day traders and swing traders looking to capture trend reversals and optimize their trading strategies.
Keep exploring
What we’ve verified
Access, alerts and repainting behaviour have not been independently verified for this indicator. Check the creator’s current publication and settings.
General descriptions and classifications are recovered research. Verified details above identify the specific checks we have completed. Check the creator’s current publication for later changes.