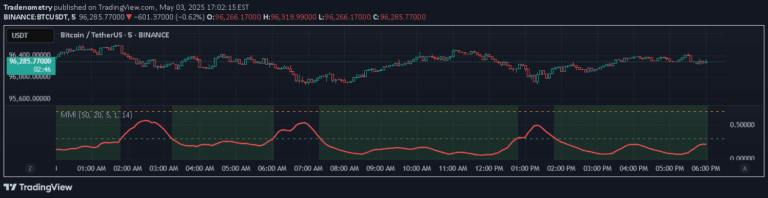
MACD/RSI is a powerful combined momentum strategy that uses two moving averages and relative strength index to identify trend direction, momentum, and potential buying or selling opportunities.
Explore complementary indicator rolesHow it works
The MACD component calculates the difference between 12-day and 26-day exponential moving averages (EMAs), tracking the convergence and divergence of these moving averages. This helps identify potential trend changes and momentum shifts in price movement. The RSI complements this by measuring the speed and magnitude of recent price changes on a scale from 0 to 100.
By combining these two indicators, traders can get a more comprehensive view of market conditions. The MACD provides insight into trend direction and momentum, while the RSI helps identify overbought and oversold conditions, creating a more robust analytical tool for making trading decisions.
Why it may be useful
The MACD/RSI strategy is crucial because it offers traders a multi-dimensional view of market dynamics by combining trend analysis and momentum indicators. It helps traders understand not just price movement direction, but also the strength and potential reversal points of those movements. This comprehensive approach reduces the likelihood of making trading decisions based on incomplete information.
By integrating two powerful technical indicators, traders can gain more confidence in their trading signals and potentially improve their market timing and entry/exit strategies. The strategy's flexibility allows it to be applied across different timeframes and market conditions, making it a versatile tool for various trading styles.
When to explore it
The MACD/RSI strategy works best in trending markets where price movements are more defined and momentum is consistent. It is particularly effective when used on higher timeframes like daily or weekly charts, where signals are more reliable and less prone to noise. Traders should look for confirmations where both MACD and RSI align, indicating strong momentum in a particular direction.
This strategy is most powerful when combined with other technical analysis tools and fundamental market understanding. Traders should be cautious during periods of high market volatility or sideways trading, where indicator signals might be less reliable. Always use risk management techniques and consider the broader market context when applying this strategy.
Keep exploring
What we’ve verified
Access, alerts and repainting behaviour have not been independently verified for this indicator. Check the creator’s current publication and settings.
General descriptions and classifications are recovered research. Verified details above identify the specific checks we have completed. Check the creator’s current publication for later changes.