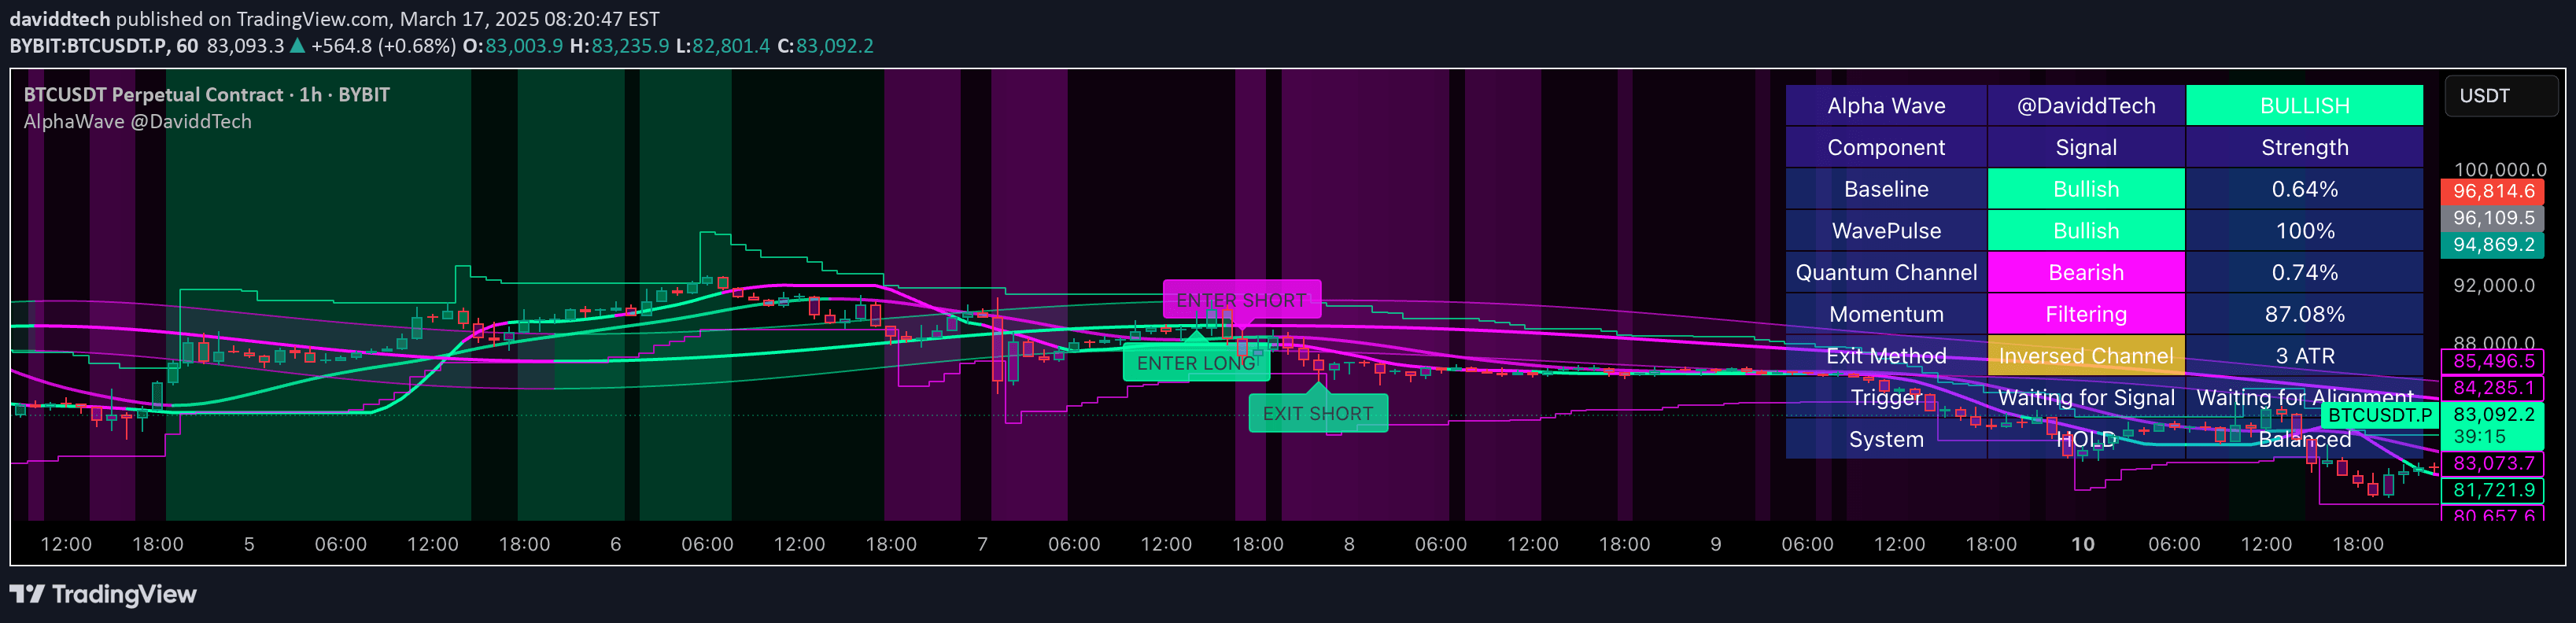
A dynamic trading indicator that adjusts entry, take-profit, and stop-loss levels using Bollinger Bands and adaptive price tracking to provide actionable market insights across multiple timeframes.
Explore complementary indicator rolesHow it works
The Adaptive Scalper uses dynamic price tracking to generate trading signals by monitoring market conditions through multiple technical analysis tools. It plots a yellow dotted entry line that follows the latest price dynamically, alongside green take-profit and red stop-loss lines that adjust in real-time.
Bollinger Bands provide additional context by measuring market volatility and potential overbought/oversold zones. The indicator generates buy signals when price crosses above the lower Bollinger Band and sell signals when price crosses below the upper Bollinger Band, helping traders time entries and exits based on momentum shifts.
Why it may be useful
The indicator provides traders with a comprehensive approach to market analysis by combining multiple technical tools into a single, adaptable system. It offers visual representation of potential trade opportunities, helping traders make more informed decisions by highlighting dynamic entry, take-profit, and stop-loss levels.
By integrating Bollinger Bands, volume analysis, and momentum indicators, the tool helps traders manage risk more effectively and identify high-probability trading scenarios across different market conditions and timeframes.
When to explore it
The Adaptive Scalper is most effective during periods of significant market volatility and clear trend movements across various financial instruments. It performs best when used on highly liquid markets like major currency pairs, stock indices, and gold, where price movements are more predictable and consistent.
Traders should utilize this indicator when seeking to capture short-term to medium-term price movements, with optimal performance on timeframes ranging from 5-minute charts for scalping to daily charts for swing trading. It is particularly useful when combined with additional confirmation tools like volume profile and trend indicators.
Keep exploring
What we’ve verified
Access, alerts and repainting behaviour have not been independently verified for this indicator. Check the creator’s current publication and settings.
General descriptions and classifications are recovered research. Verified details above identify the specific checks we have completed. Check the creator’s current publication for later changes.