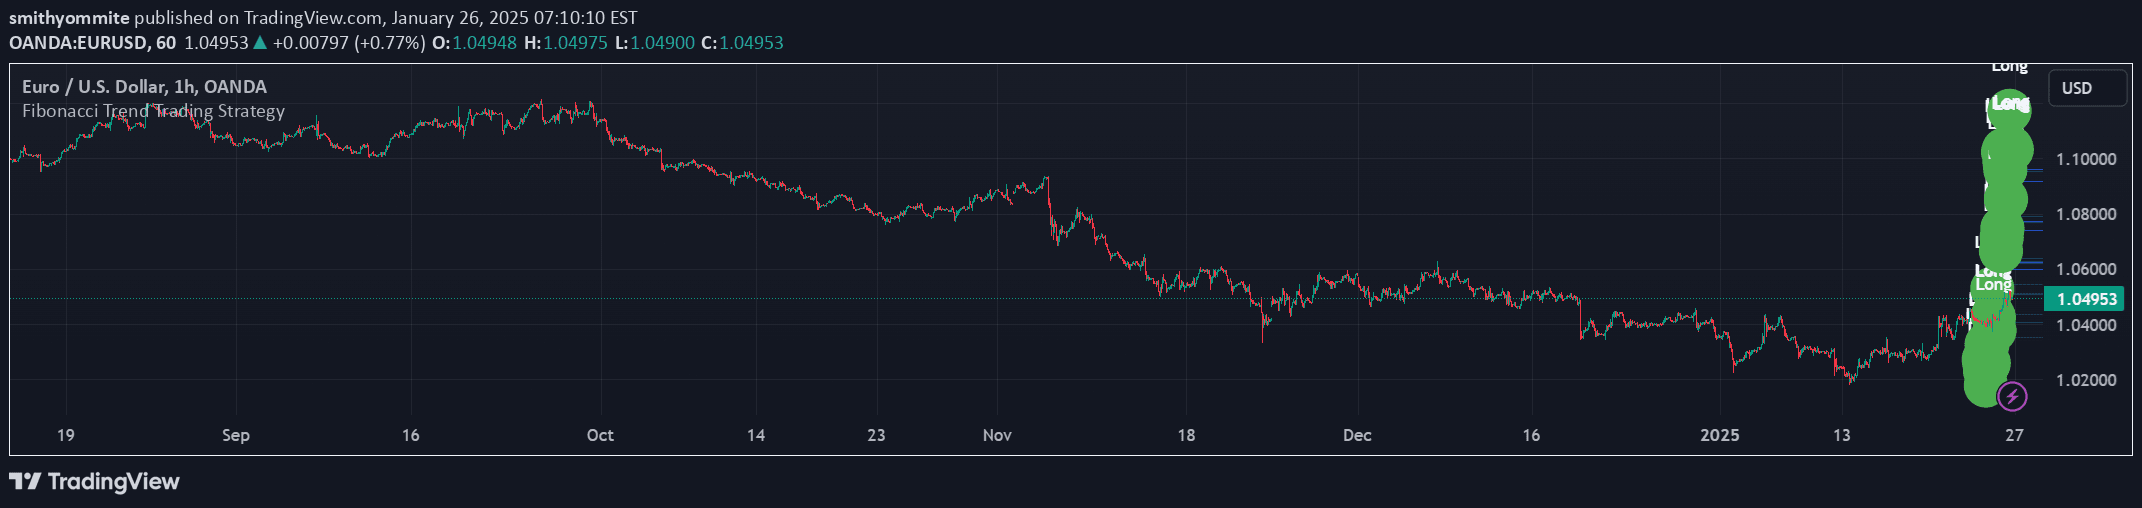
A Fibonacci-based indicator that calculates moving averages using past highs and lows to create dynamic support and resistance zones for trend analysis.
Explore complementary indicator rolesHow it works
The Fibonacci Step Indicator calculates moving averages using Fibonacci sequence periods, specifically focusing on historical highs and lows. It selects values from the first twelve Fibonacci numbers (2, 3, 5, 8, etc.) to create a unique moving average calculation method.
By taking the mean of past lows and highs at these specific Fibonacci periods, the indicator generates a dynamic support and resistance zone. This approach creates a flexible framework that adapts to market movements, providing traders with a nuanced view of potential trend boundaries and price behavior.
Why it may be useful
The Fibonacci Step Indicator offers traders a sophisticated method of identifying market trends and potential support/resistance zones. By leveraging Fibonacci sequence periods, it provides a more irregular and potentially more responsive analysis compared to traditional moving averages.
Its unique calculation method allows traders to gain insights into market dynamics that might be missed by standard indicators. The indicator helps visualize potential trend directions and create a framework for understanding price movements across different timeframes.
When to explore it
The Fibonacci Step Indicator is most effective during trending markets where clear directional movement is present. Traders can use this indicator to identify potential entry and exit points, especially when the price is moving within the defined support and resistance zones.
However, traders should be cautious during ranging markets, where price fluctuates within a tight zone without a clear trend. In such scenarios, the indicator may provide less reliable signals, and additional confirmation from other technical tools is recommended.
Keep exploring
What we’ve verified
Access, alerts and repainting behaviour have not been independently verified for this indicator. Check the creator’s current publication and settings.
General descriptions and classifications are recovered research. Verified details above identify the specific checks we have completed. Check the creator’s current publication for later changes.