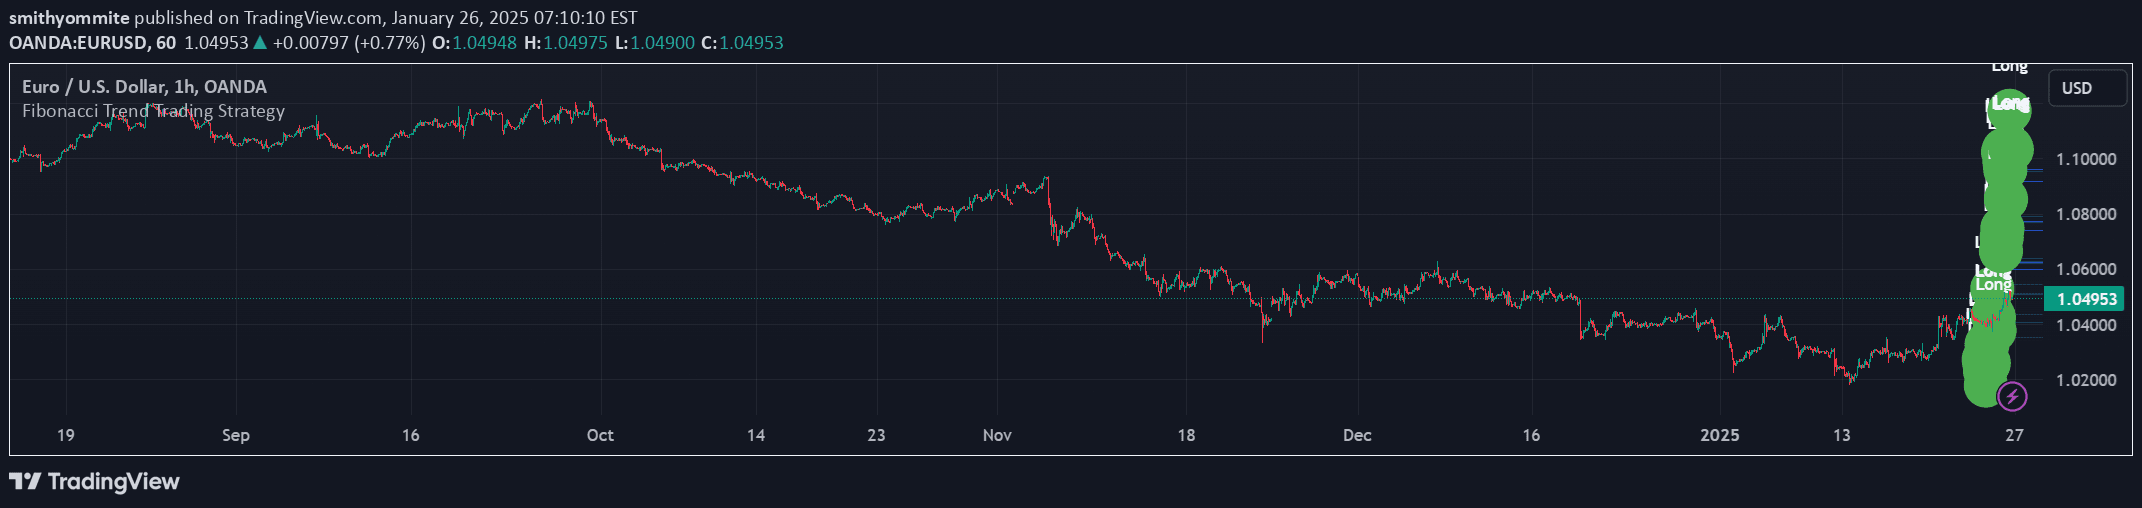
Fibonacci Buy /Sell Signals
A Fibonacci-based indicator that identifies potential support and resistance zones by plotting key retracement levels and generating buy/sell signals based on price interactions.
Explore 11,183 indicators. Filter beyond the obvious.
Discover the tools that fit the way you trade.
11,183 tools to explore
A Fibonacci-based indicator that identifies potential support and resistance zones by plotting key retracement levels and generating buy/sell signals based on price interactions.
A Fibonacci-based indicator that calculates moving averages using past highs and lows to create dynamic support and resistance zones for trend analysis.
A multi-timeframe trading strategy using Fibonacci extensions and retracements to identify trend direction, entry points, and potential profit targets across weekly, daily, and four-hour charts.
A technical analysis tool that marks significant days on price charts using Fibonacci sequence numbers to identify potential market turning points and areas of trading interest.
Likes, views, and comments are historical TradingView snapshots. They describe attention, not trading performance.