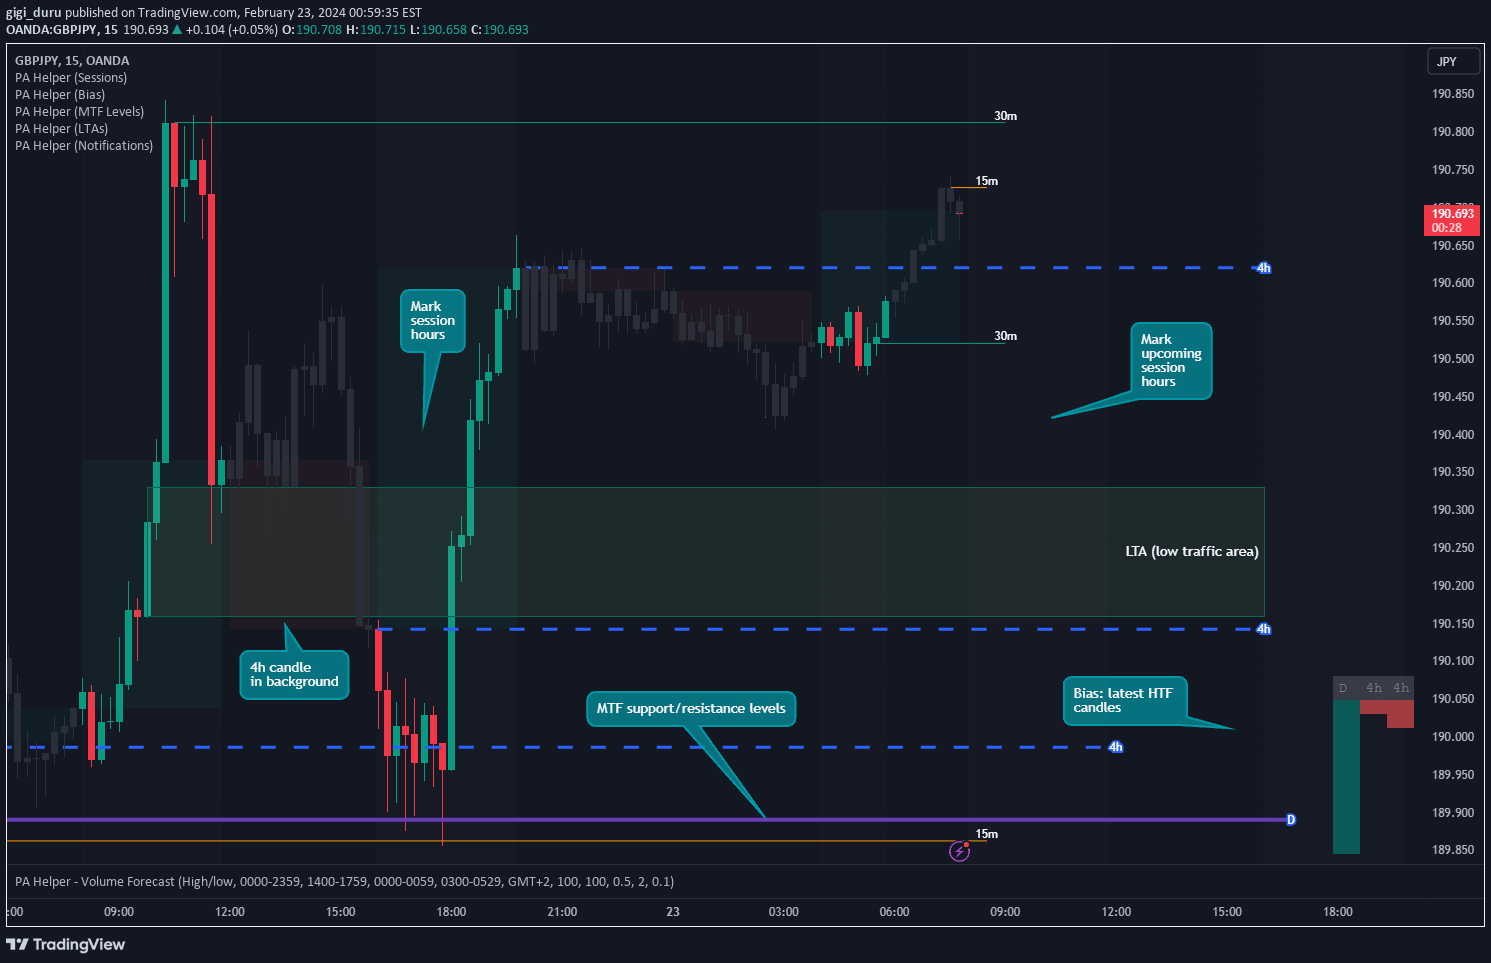
An automated Fibonacci retracement tool that plots dynamic support and resistance levels based on a customizable lookback period, helping traders identify potential price reversal zones.
Explore complementary indicator rolesHow it works
The Auto Fibonacci indicator works by automatically calculating Fibonacci retracement levels using a user-defined lookback period. It identifies the highest high and lowest low within that timeframe and generates precise Fibonacci levels at 0.236, 0.382, 0.5, 0.618, and 0.786 percentages.
The script uses two core functions to calculate these levels: one based on historical price ranges and another from the current candle's high. By dynamically plotting these levels as step lines, traders can quickly visualize potential support and resistance zones that might influence future price movements.
Why it may be useful
Fibonacci retracement levels are crucial tools for technical analysts seeking to understand potential price reversal points and market psychology. By providing mathematically derived levels, this indicator helps traders identify key areas where price might pause, consolidate, or change direction during trending markets.
The automated nature of this tool saves traders significant time in manual calculations, allowing them to focus on interpreting market dynamics rather than performing repetitive mathematical computations. Its flexibility in level selection and lookback period customization makes it adaptable to various trading styles and market conditions.
When to explore it
The Auto Fibonacci indicator is most effective during trending markets with clear directional movements, where price is likely to respect mathematical retracement levels. It works particularly well in markets experiencing sustained bullish or bearish momentum, helping traders identify potential entry and exit points based on historical price behavior.
Traders should use this indicator in conjunction with other technical analysis tools to confirm signals and reduce false positives. It is especially valuable for identifying potential support and resistance levels during pullbacks in strong trends, providing traders with precise zones for potential trade execution.
Keep exploring
What we’ve verified
Access, alerts and repainting behaviour have not been independently verified for this indicator. Check the creator’s current publication and settings.
General descriptions and classifications are recovered research. Verified details above identify the specific checks we have completed. Check the creator’s current publication for later changes.