
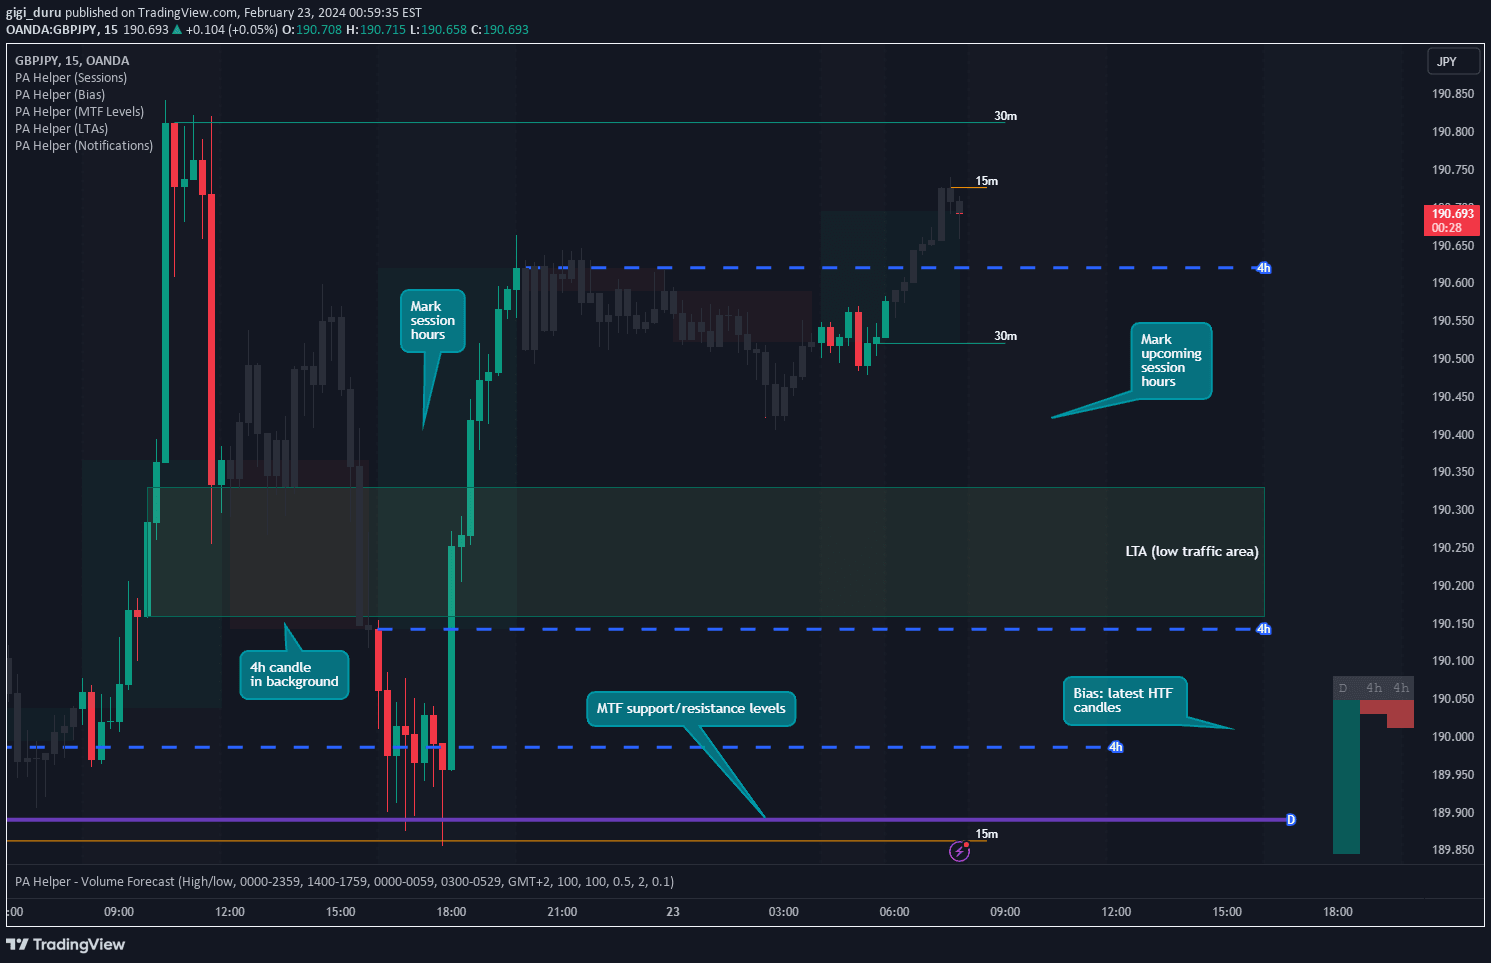
A multi-timeframe support and resistance indicator that dynamically calculates key price levels across different time intervals, helping traders identify potential market reversal zones.
Explore complementary indicator rolesHow it works
The Multi-Timeframe Support and Resistance Lines indicator analyzes price action across multiple configurable timeframes to generate dynamic support and resistance levels. It uses advanced algorithmic calculations to identify key price zones where market momentum might potentially reverse or stall.
By processing historical price data, the indicator creates color-coded lines representing critical support and resistance levels. Traders can customize the timeframes to focus on specific market segments, allowing for a more targeted and precise analysis of potential trading opportunities.
Why it may be useful
Support and resistance lines are crucial for understanding market psychology and potential price movement boundaries. This indicator provides traders with a comprehensive view of key price levels, helping them make more informed trading decisions by identifying potential entry and exit points.
By offering a multi-timeframe perspective, the indicator helps traders recognize confluence zones where multiple timeframes suggest strong support or resistance. This enhanced visibility allows traders to develop more robust trading strategies and reduce the risk of entering trades at unfavorable price levels.
When to explore it
The Multi-Timeframe Support and Resistance Lines indicator is most effective during periods of market consolidation or when price is approaching known support and resistance zones. Traders can use this tool to validate potential trade setups and confirm trend reversals across different timeframes.
It is particularly useful in volatile markets where clear price levels can help manage risk and identify potential breakout or breakdown scenarios. Traders can apply this indicator across various financial instruments, including stocks, forex, cryptocurrencies, and commodities, to enhance their technical analysis approach.
Keep exploring
What we’ve verified
Access, alerts and repainting behaviour have not been independently verified for this indicator. Check the creator’s current publication and settings.
General descriptions and classifications are recovered research. Verified details above identify the specific checks we have completed. Check the creator’s current publication for later changes.


