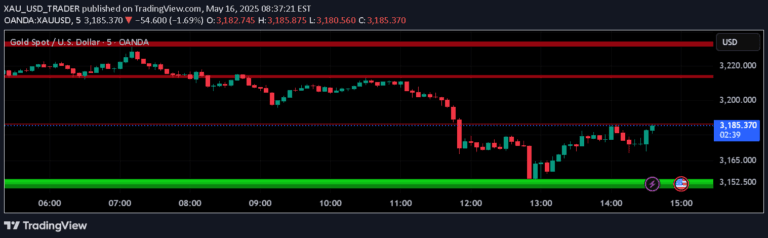
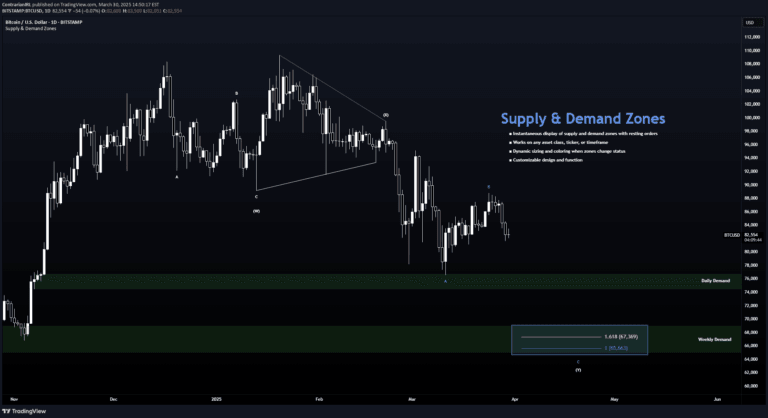
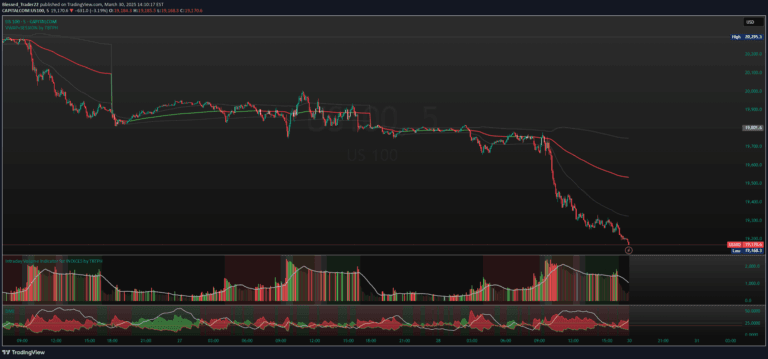
A dynamic indicator using two simple moving averages to create a trading zone, highlighting breakouts, tests, and retests with volume and price spread confirmation.
Explore complementary indicator rolesHow it works
The indicator creates a dynamic zone between two simple moving averages calculated from price lows and highs. It identifies key price interactions like breakouts, where the price closes above or below the zone boundaries, requiring confirmation through volume or bar spread criteria.
As price interacts with the zone, the indicator labels different interactions such as initial tests and subsequent retests. Each re-entry into the zone provides insight into the zone's diminishing strength, tracking the traditional support and resistance theory through progressive interactions.
Why it may be useful
This indicator provides traders with a sophisticated method of understanding price dynamics within a defined zone, offering visual and quantitative insights into potential trend changes and market momentum. By tracking breakouts and zone interactions, traders can gain a more nuanced understanding of price behavior and potential entry or exit points.
The dynamic nature of the zone allows for adaptive analysis that responds to changing market conditions, making it a versatile tool for traders seeking to understand complex price movements and potential trend reversals.
When to explore it
The indicator is most effective in markets with clear directional trends and sufficient price volatility to generate meaningful zone interactions. It works best in timeframes that allow for multiple zone tests, such as intraday and short-term trading environments where price movements are more frequent and pronounced.
Traders should use this indicator in conjunction with other technical analysis tools to confirm signals and reduce false positives. It is particularly useful for identifying potential trend reversals, breakout opportunities, and assessing the strength of support and resistance levels in dynamic market conditions.
Keep exploring
What we’ve verified
Access, alerts and repainting behaviour have not been independently verified for this indicator. Check the creator’s current publication and settings.
General descriptions and classifications are recovered research. Verified details above identify the specific checks we have completed. Check the creator’s current publication for later changes.