
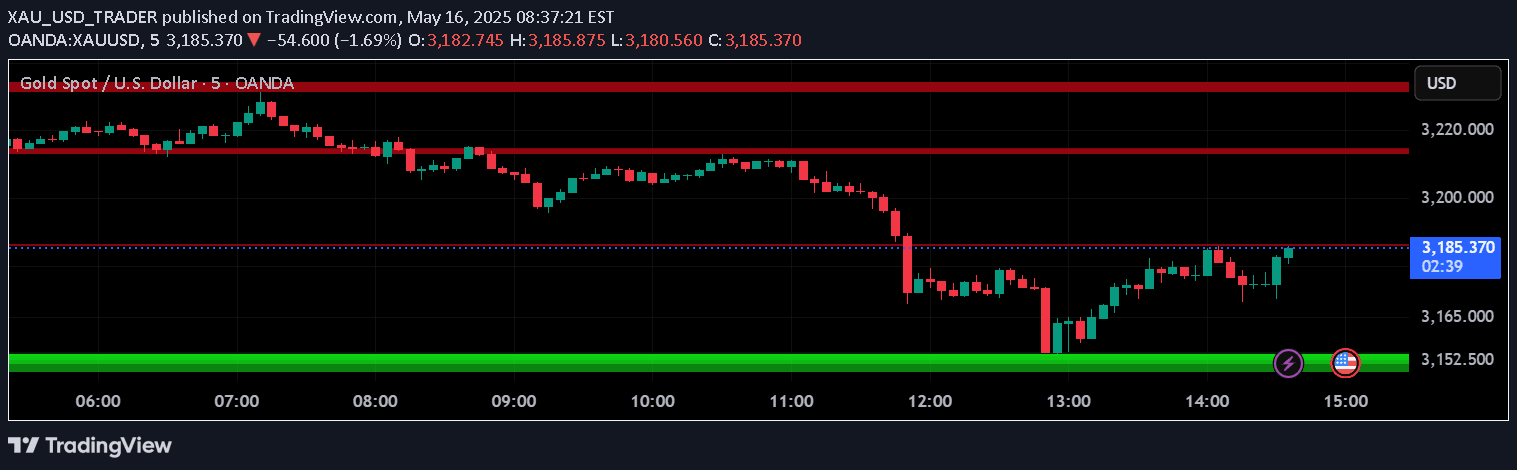
A comprehensive technical analysis toolkit that provides dynamic EMA/SMA tracking, multi-timeframe support and resistance zones, and price action-based trading signals for precise market entry and exit strategies.
Explore complementary indicator rolesHow it works
The A.K Dynamic EMA/SMA Toolkit operates by analyzing price action across multiple timeframes to detect critical support and resistance zones. It uses swing highs and lows to automatically identify and color-code dynamic zones, providing traders with visual insights into potential market turning points.
The system generates buy and sell signals by evaluating how price interacts with these zones, considering factors like candle body, wick characteristics, and zone strength. Traders can customize the indicator's parameters, including EMA/SMA line visibility, zone detection sensitivity, and signal confirmation thresholds.
Why it may be useful
This toolkit simplifies complex technical analysis by consolidating multiple indicators into a single, intuitive interface that helps traders quickly understand market structure and potential trade opportunities. By providing clear visual representations of support and resistance zones, the indicator reduces the cognitive load of interpreting market movements.
The comprehensive approach allows traders to develop more disciplined and systematic trading strategies, reducing emotional decision-making and providing a structured framework for identifying high-probability trade setups across different timeframes and market conditions.
When to explore it
The A.K Dynamic EMA/SMA Toolkit is most effective in trending and range-bound markets where clear support and resistance levels can be identified. It performs exceptionally well in liquid markets with consistent price action, such as major forex pairs, stock indices, and high-volume cryptocurrencies.
Traders should leverage this tool when they want a holistic view of market structure, combining trend analysis, zone detection, and precise entry/exit signals. It is particularly useful for traders seeking to develop a systematic approach to technical analysis that works across scalping, day trading, and swing trading timeframes.
Keep exploring
What we’ve verified
Access, alerts and repainting behaviour have not been independently verified for this indicator. Check the creator’s current publication and settings.
General descriptions and classifications are recovered research. Verified details above identify the specific checks we have completed. Check the creator’s current publication for later changes.


