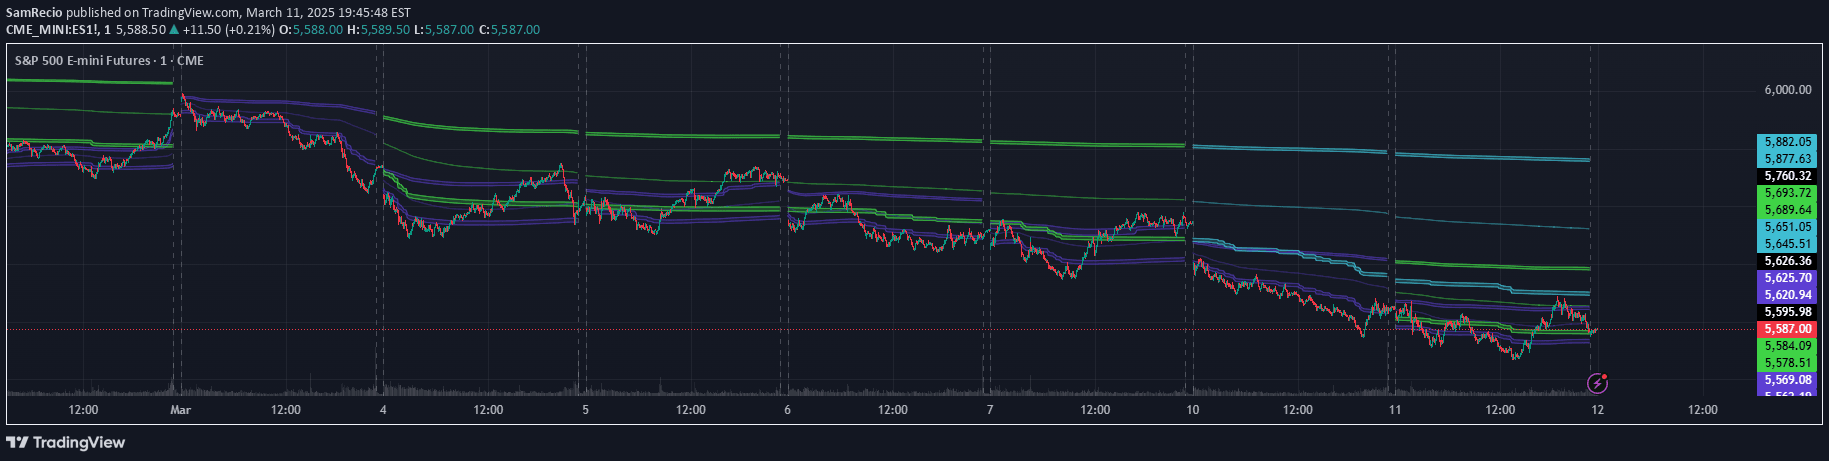
A multi-timeframe support and resistance tool that automatically plots key market levels across daily, weekly, and monthly periods to help traders identify potential entry and exit points.
Explore complementary indicator rolesHow it works
The Multi-Timeframe Support & Resistance Tool automatically identifies and plots previous period highs and lows across three key timeframes: daily, weekly, and monthly. It uses historical price action to create visual reference lines on the chart, highlighting significant price levels that have previously acted as support or resistance zones.
The tool color-codes these levels for easy differentiation: green for daily, blue for weekly, and purple for monthly. These levels are dynamically updated and refreshed periodically to ensure traders have the most current market information, helping them quickly recognize potential key trading areas.
Why it may be useful
Support and resistance levels are critical for understanding market psychology and potential price turning points. By providing a clear visual representation of these key levels across multiple timeframes, traders can make more informed decisions about potential entry and exit points, trend continuation, or potential reversals.
The tool simplifies complex price action analysis by automatically identifying and highlighting significant market levels. This allows traders to quickly assess potential trading opportunities, understand market structure, and develop more strategic trading approaches without manually drawing and tracking these important price levels.
When to explore it
This tool is most effective in markets with clear trending or ranging behavior where price tends to respect historical support and resistance levels. It works particularly well for traders who want to identify potential breakout or rejection zones across different trading timeframes.
Traders can utilize this tool in various market conditions, including forex, stocks, cryptocurrencies, and commodities. It is especially useful for confirming trade entries, setting stop-loss levels, and understanding overall market structure across different time horizons.
Keep exploring
What we’ve verified
Access, alerts and repainting behaviour have not been independently verified for this indicator. Check the creator’s current publication and settings.
General descriptions and classifications are recovered research. Verified details above identify the specific checks we have completed. Check the creator’s current publication for later changes.