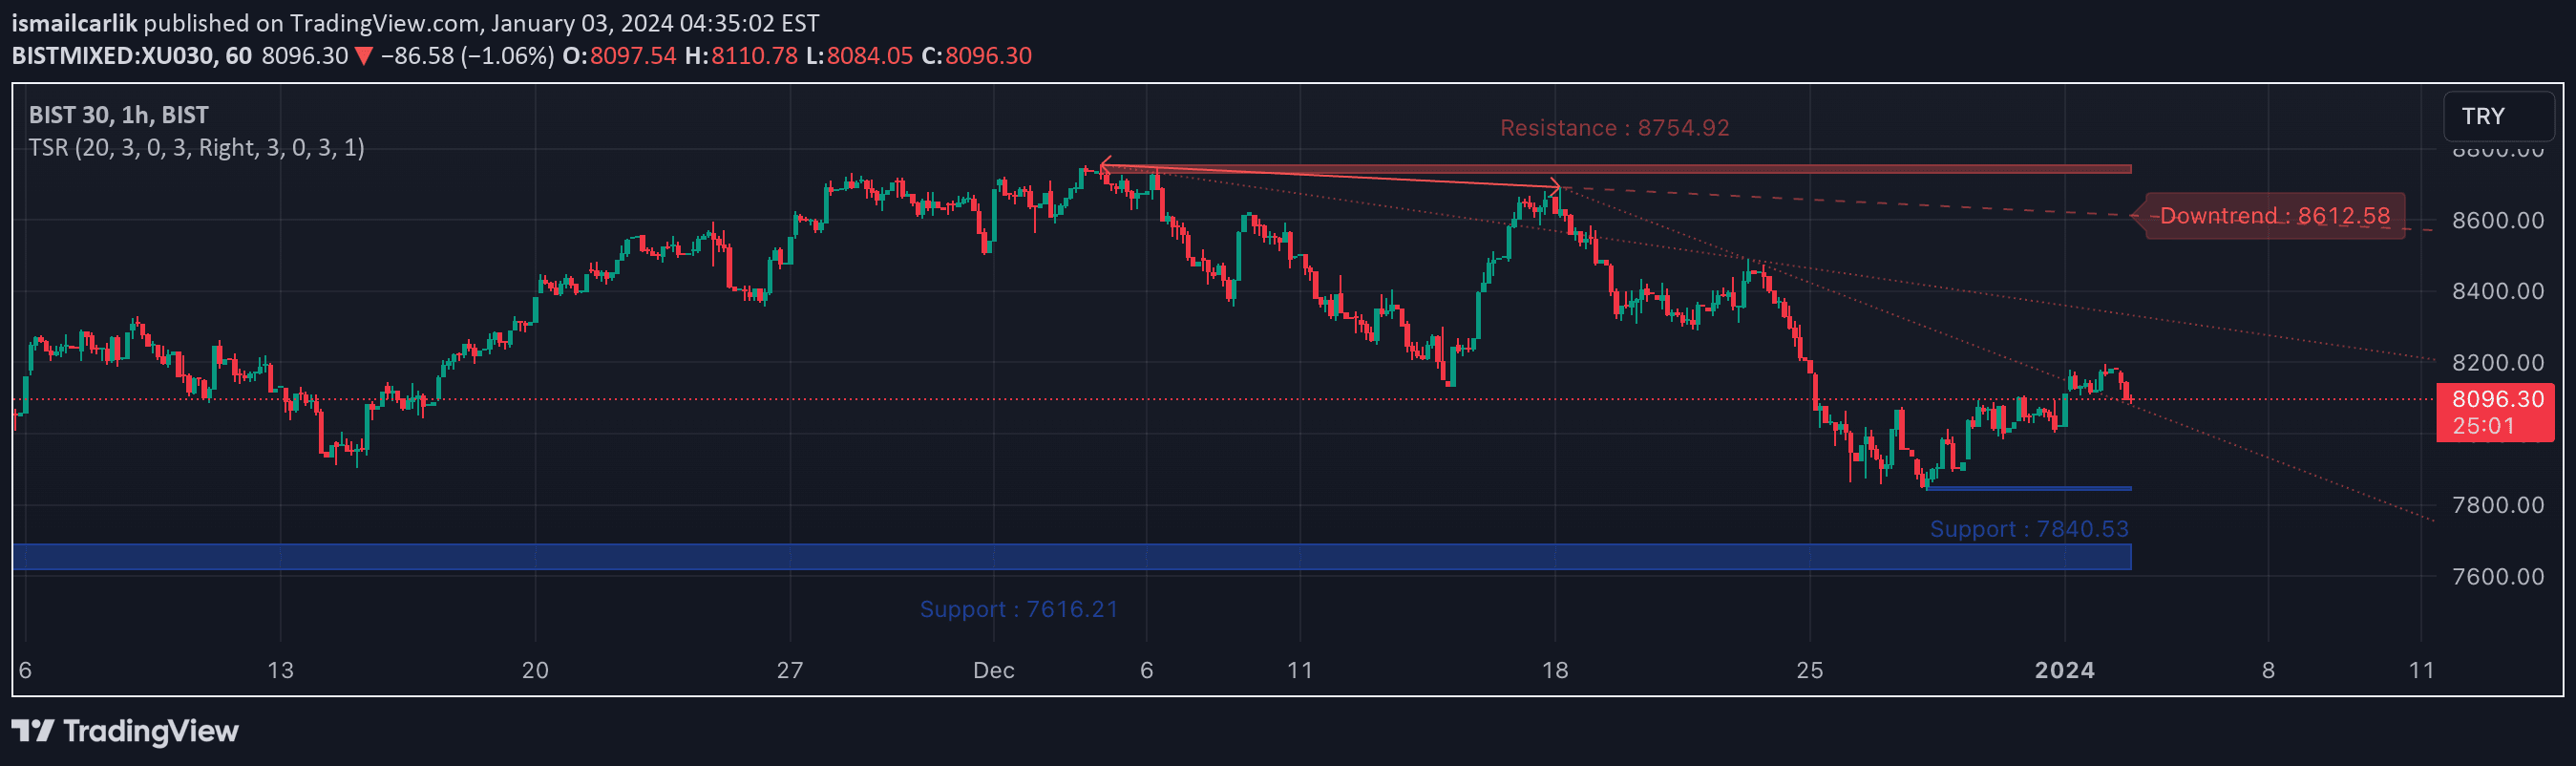
A dynamic support and resistance indicator that identifies key price levels using volume analysis and pivot points, providing adaptive visual cues for potential market entry and exit points.
Explore complementary indicator rolesHow it works
The Support and Resistance indicator calculates key price levels through a sophisticated rolling Point of Control (POC) method that analyzes volume distribution across different price ranges. It uses a custom function to track trading activity and determine significant price levels, incorporating both volume-based analysis and pivot point calculations.
The indicator dynamically adjusts its calculations based on selected market view options: short term, standard, and long term. These settings modify the lookback periods, allowing traders to customize the indicator's sensitivity to market movements and adapt it to different trading styles and timeframes.
Why it may be useful
This indicator provides traders with a comprehensive view of potential support and resistance levels by combining multiple analytical techniques, offering deeper insights into market structure than traditional methods. Its volume-based approach helps identify where the most significant trading activity occurs, giving traders a more nuanced understanding of potential price reversals and trend continuations.
The adaptive features, such as dynamic line thickness and color-coding, allow traders to quickly assess the strength and current relevance of support and resistance levels. By highlighting areas of potential market interest, the indicator helps traders make more informed decisions about entry, exit, and risk management strategies.
When to explore it
The Support and Resistance indicator is most effective in markets with clear volume profiles and identifiable price patterns, such as highly liquid stocks, forex pairs, and major index futures. Traders can leverage this tool during periods of consolidation or when looking to identify potential breakout or breakdown levels, as the indicator provides visual cues about market sentiment and potential price movements.
It is particularly useful for traders seeking a versatile tool that can be adapted to different timeframes and trading styles. The indicator's ability to dynamically adjust its calculations and display makes it valuable for scalpers, day traders, and swing traders who require flexible and insightful market analysis tools.
Keep exploring
What we’ve verified
Access, alerts and repainting behaviour have not been independently verified for this indicator. Check the creator’s current publication and settings.
General descriptions and classifications are recovered research. Verified details above identify the specific checks we have completed. Check the creator’s current publication for later changes.