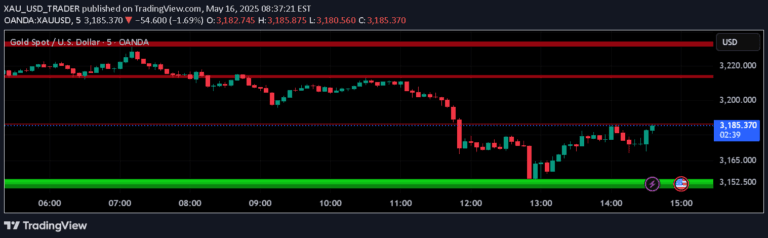
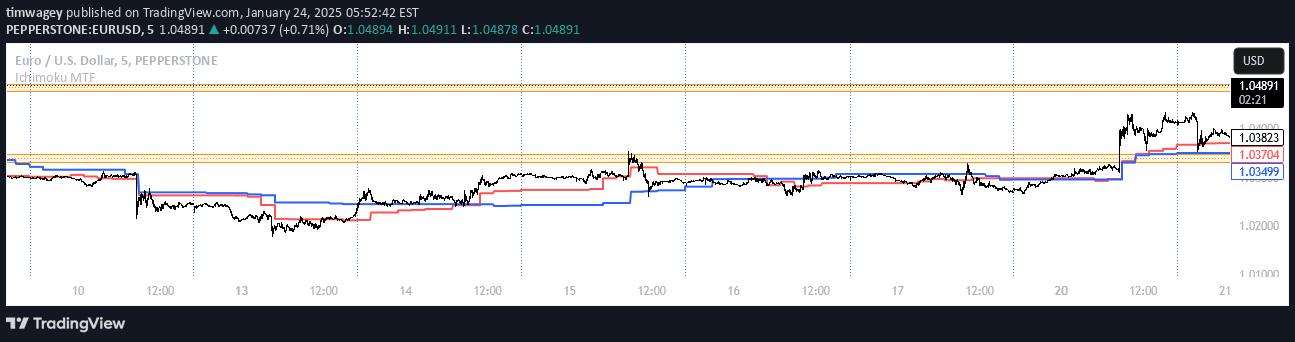
A multi-timeframe analysis tool that calculates price extension levels, tracks open/close prices, and uses EMA crossovers to identify potential trading opportunities across different timeframes.
Explore complementary indicator rolesHow it works
The script analyzes two different timeframes simultaneously, calculating extension levels at 10%, 21%, 31%, 51%, and 61% based on previous price ranges. It plots these extension levels both positively and negatively, providing visual cues for potential price movements and key reference points.
Additionally, the script incorporates Exponential Moving Average (EMA) calculations for 5, 15, and 20 periods, which can generate crossover signals. These EMAs are plotted on the chart, allowing traders to identify potential trend changes and momentum shifts through the interactions between different EMA periods.
Why it may be useful
Multi-timeframe analysis provides traders with a comprehensive view of market dynamics, helping them make more informed trading decisions by understanding price behavior across different time horizons. The extension levels offer critical insights into potential support, resistance, breakout, and retracement points, enabling more precise entry and exit strategies.
The EMA crossover component adds an additional layer of technical analysis, helping traders identify trend changes and momentum shifts. By combining extension levels with EMA signals, traders can develop more robust trading strategies that account for both price action and trend momentum.
When to explore it
This signal works best in markets with clear trending characteristics, where price movements can be analyzed across multiple timeframes. It is particularly effective when used on daily and weekly charts, allowing traders to identify broader market trends and potential reversal points with greater accuracy.
Traders should utilize this tool when seeking to confirm trend strength, identify potential breakout or retracement levels, and develop more sophisticated trading strategies that incorporate both price action and moving average dynamics. It is especially useful for traders who want a comprehensive view of market movements across different time horizons.
Keep exploring
What we’ve verified
Access, alerts and repainting behaviour have not been independently verified for this indicator. Check the creator’s current publication and settings.
General descriptions and classifications are recovered research. Verified details above identify the specific checks we have completed. Check the creator’s current publication for later changes.