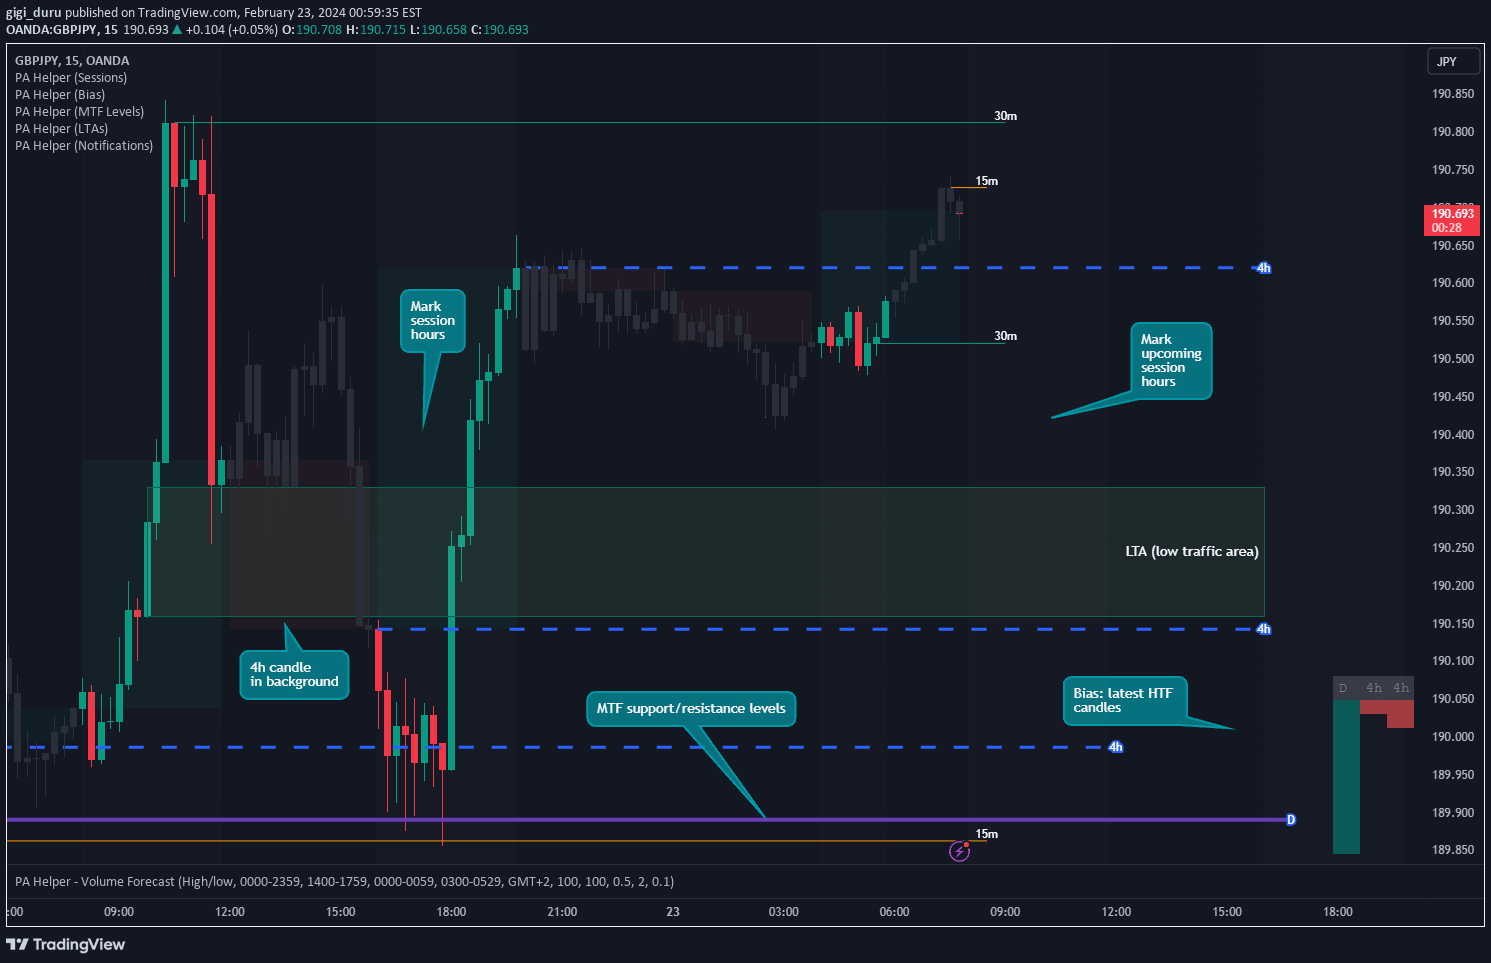
A multi-timeframe indicator that visualizes price ranges across two different time periods using color-coded boxes for trend analysis and support/resistance identification.
Explore complementary indicator rolesHow it works
The Duo Multi-Time Period Charts indicator creates visual boxes representing price ranges for two selected timeframes, using either High/Low Range, True Range, or Heikin Ashi Range calculation methods. Each box is color-coded to indicate bullish or bearish price movement based on the period's open and close prices.
The indicator overlays these boxes directly on the chart, allowing traders to instantly compare price behavior across different time horizons. By selecting different calculation methods, traders can customize how the range is determined, providing flexibility in analyzing price action and volatility.
Why it may be useful
Multi-timeframe analysis is crucial for understanding market dynamics beyond a single time perspective, helping traders make more informed decisions by revealing broader market context. This indicator simplifies complex multi-timeframe analysis by presenting information in an intuitive, color-coded visual format that quickly communicates trend strength and direction.
By reducing the complexity of comparing different timeframes, traders can more easily identify potential trend confirmations, support and resistance levels, and overall market sentiment across multiple time horizons without overwhelming their chart with multiple indicators.
When to explore it
The Duo Multi-Time Period Charts indicator is most effective when traders want to gain a comprehensive view of market trends across different time scales, such as during periods of market transition or when analyzing potential entry and exit points. It works particularly well for traders who need to understand both short-term price movements and longer-term market trends simultaneously.
Traders can benefit most from this tool when markets are experiencing complex price action, when looking to confirm trend strength, or when trying to identify potential support and resistance levels that might not be apparent on a single timeframe view.
Keep exploring
What we’ve verified
Access, alerts and repainting behaviour have not been independently verified for this indicator. Check the creator’s current publication and settings.
General descriptions and classifications are recovered research. Verified details above identify the specific checks we have completed. Check the creator’s current publication for later changes.