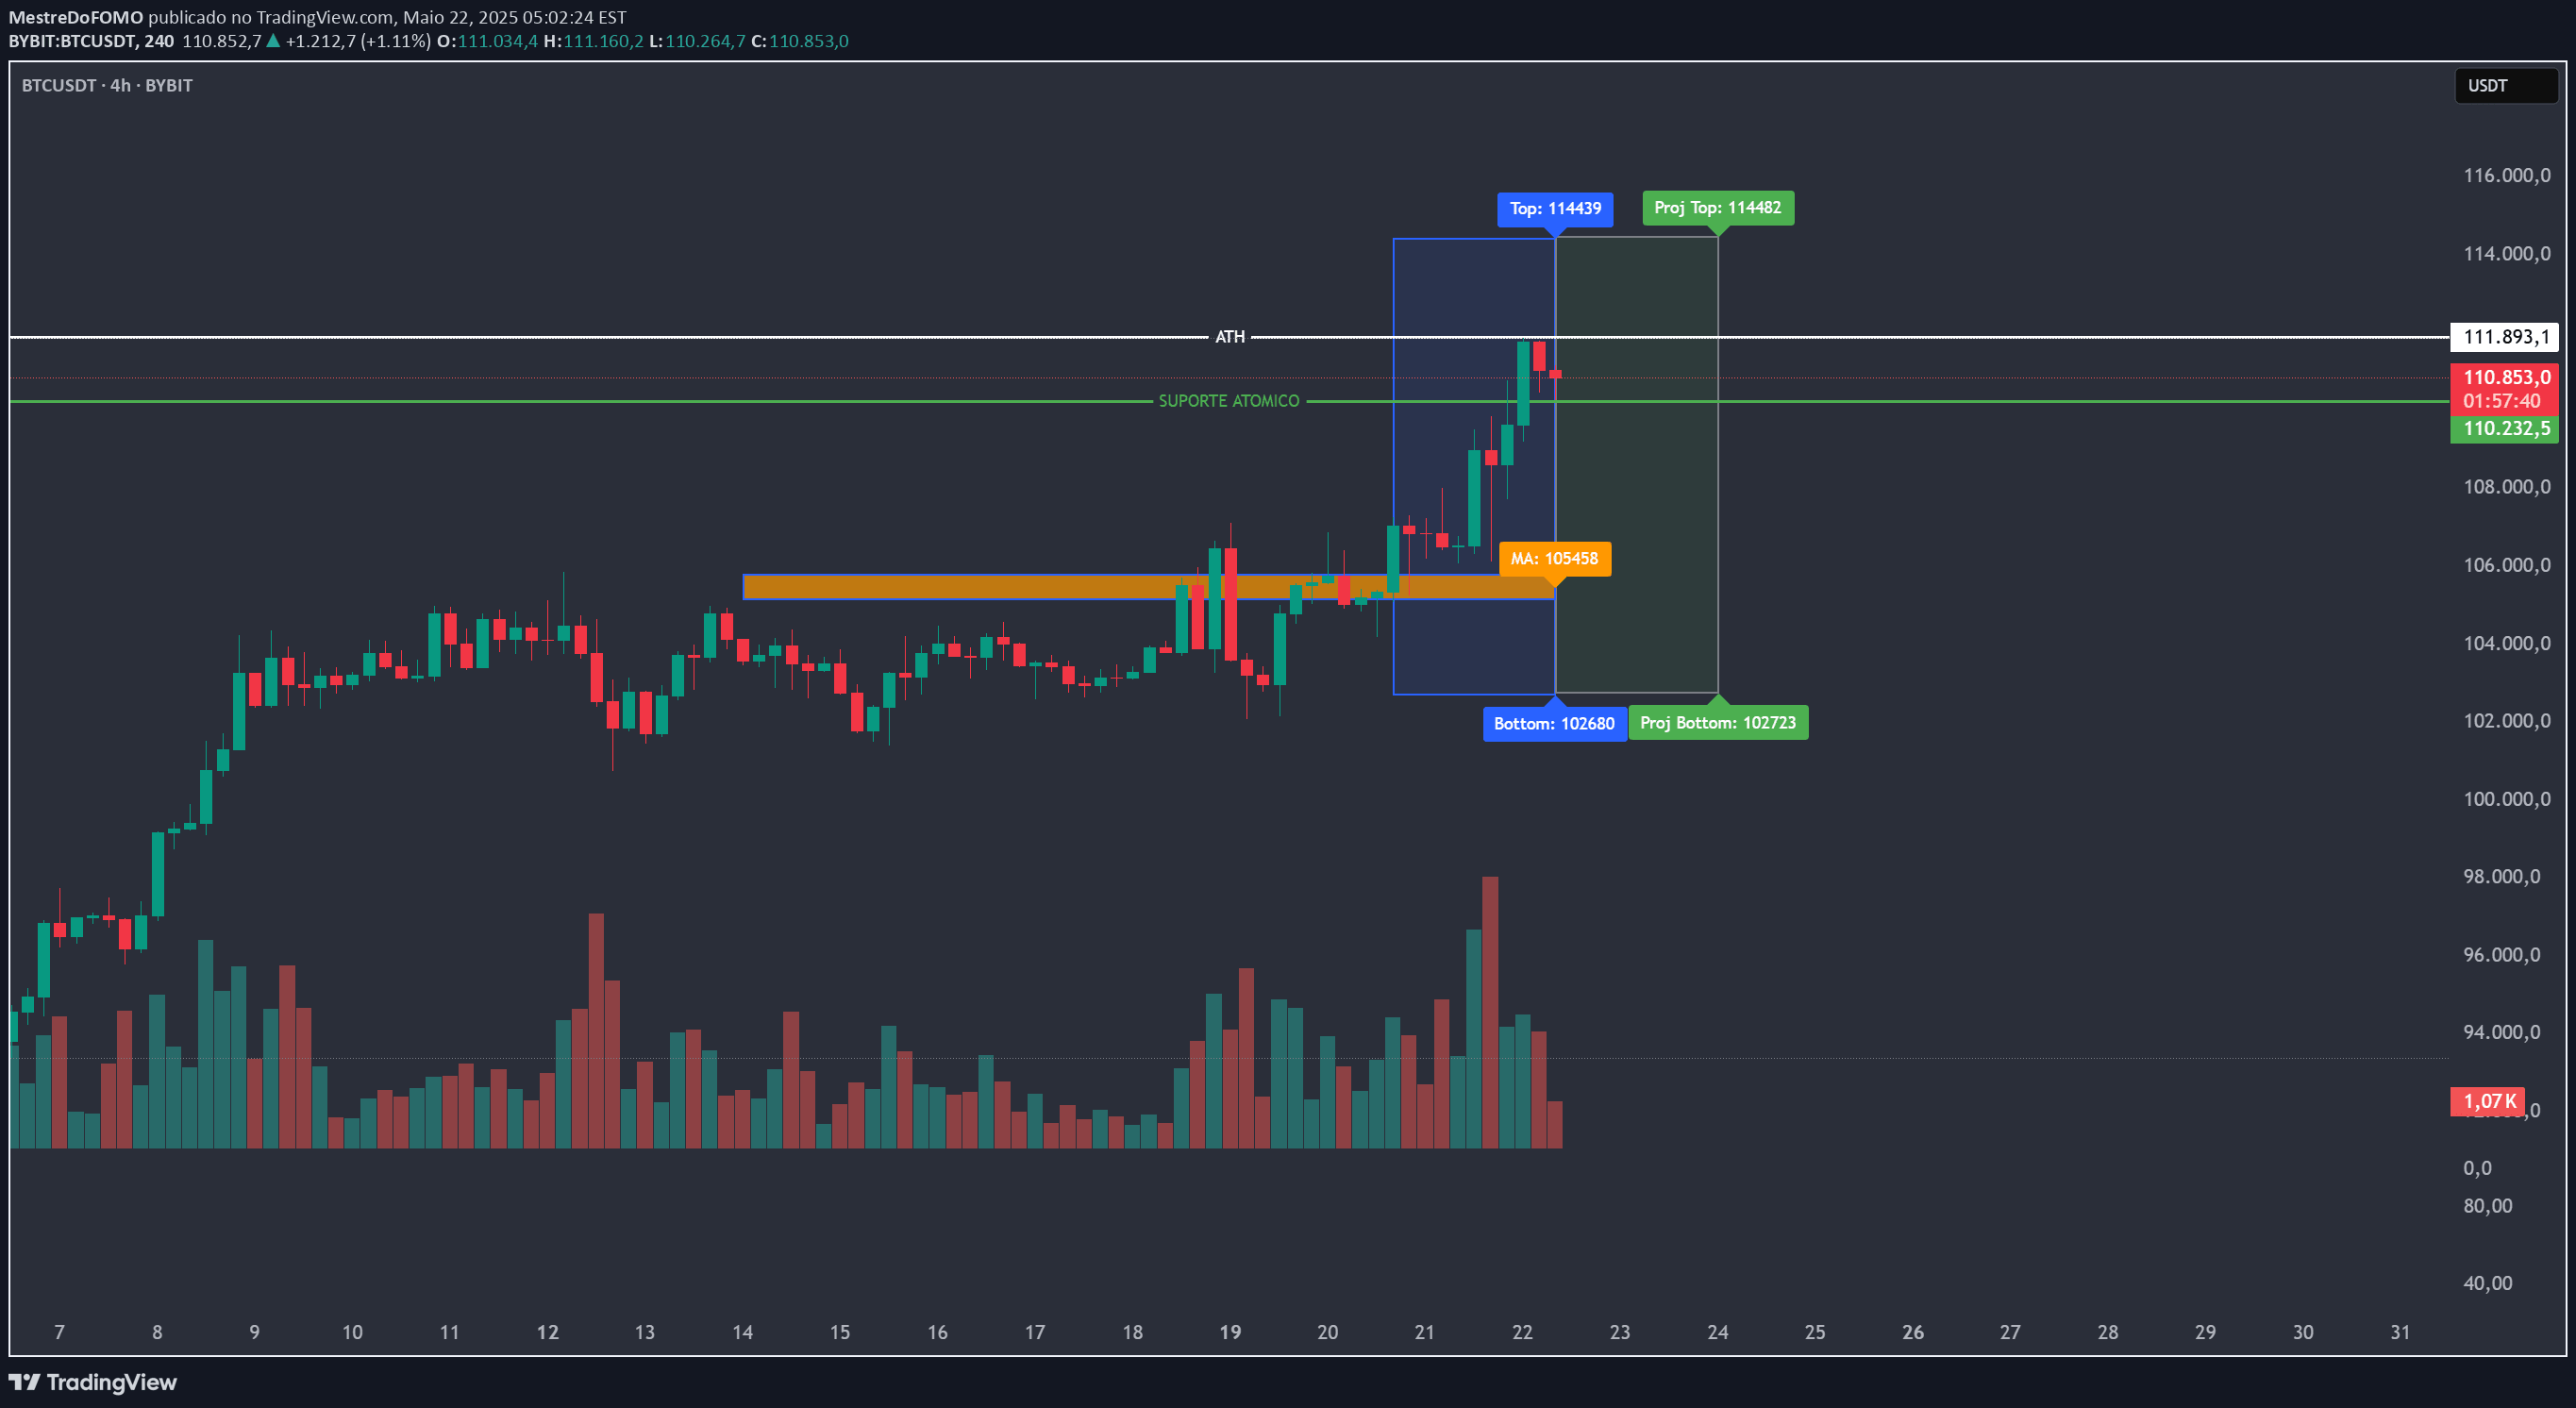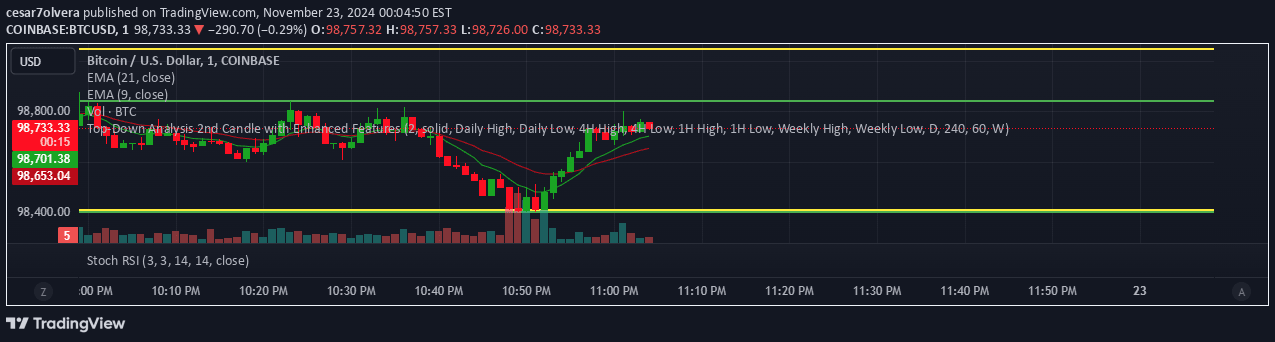
A multi-timeframe analysis tool that plots horizontal lines from previous candle high and low levels across different timeframes, offering traders comprehensive price reference points.
Explore complementary indicator rolesHow it works
The indicator scans multiple timeframes including Daily, 4-Hour, 1-Hour, and Weekly to identify the previous candle's high and low price levels. It then plots horizontal lines representing these significant price points, allowing traders to visualize key reference levels dynamically across different time perspectives.
Traders can customize the appearance of these lines by adjusting colors, styles, and widths to suit their visual preferences. The script also enables users to add text labels to each line, which can be dynamically moved to remain visible as new candles form, enhancing the analytical value of the multi-timeframe reference points.
Why it may be useful
Multi-timeframe analysis provides traders with a more comprehensive view of market dynamics, helping them understand price action beyond a single timeframe. By displaying previous candle highs and lows across different time perspectives, traders can identify potential support and resistance levels, anticipate price movements, and make more informed trading decisions.
The customizable nature of the indicator allows traders to personalize their analysis, making it adaptable to various trading styles and strategies. The ability to toggle line visibility, set price alerts, and adjust visual parameters means traders can focus on the most relevant information for their specific trading approach.
When to explore it
This indicator is most effective for traders seeking a holistic view of market trends and price levels across multiple timeframes. It is particularly useful during periods of market volatility, when understanding price dynamics from different perspectives can provide critical insights into potential trend reversals or continuation patterns.
Traders can leverage this tool during key market sessions, such as during economic announcements, earnings reports, or when analyzing instruments with complex price movements. It is especially valuable for day traders, swing traders, and technical analysts who rely on comprehensive market analysis to inform their trading strategies.
Keep exploring
What we’ve verified
Access, alerts and repainting behaviour have not been independently verified for this indicator. Check the creator’s current publication and settings.
General descriptions and classifications are recovered research. Verified details above identify the specific checks we have completed. Check the creator’s current publication for later changes.