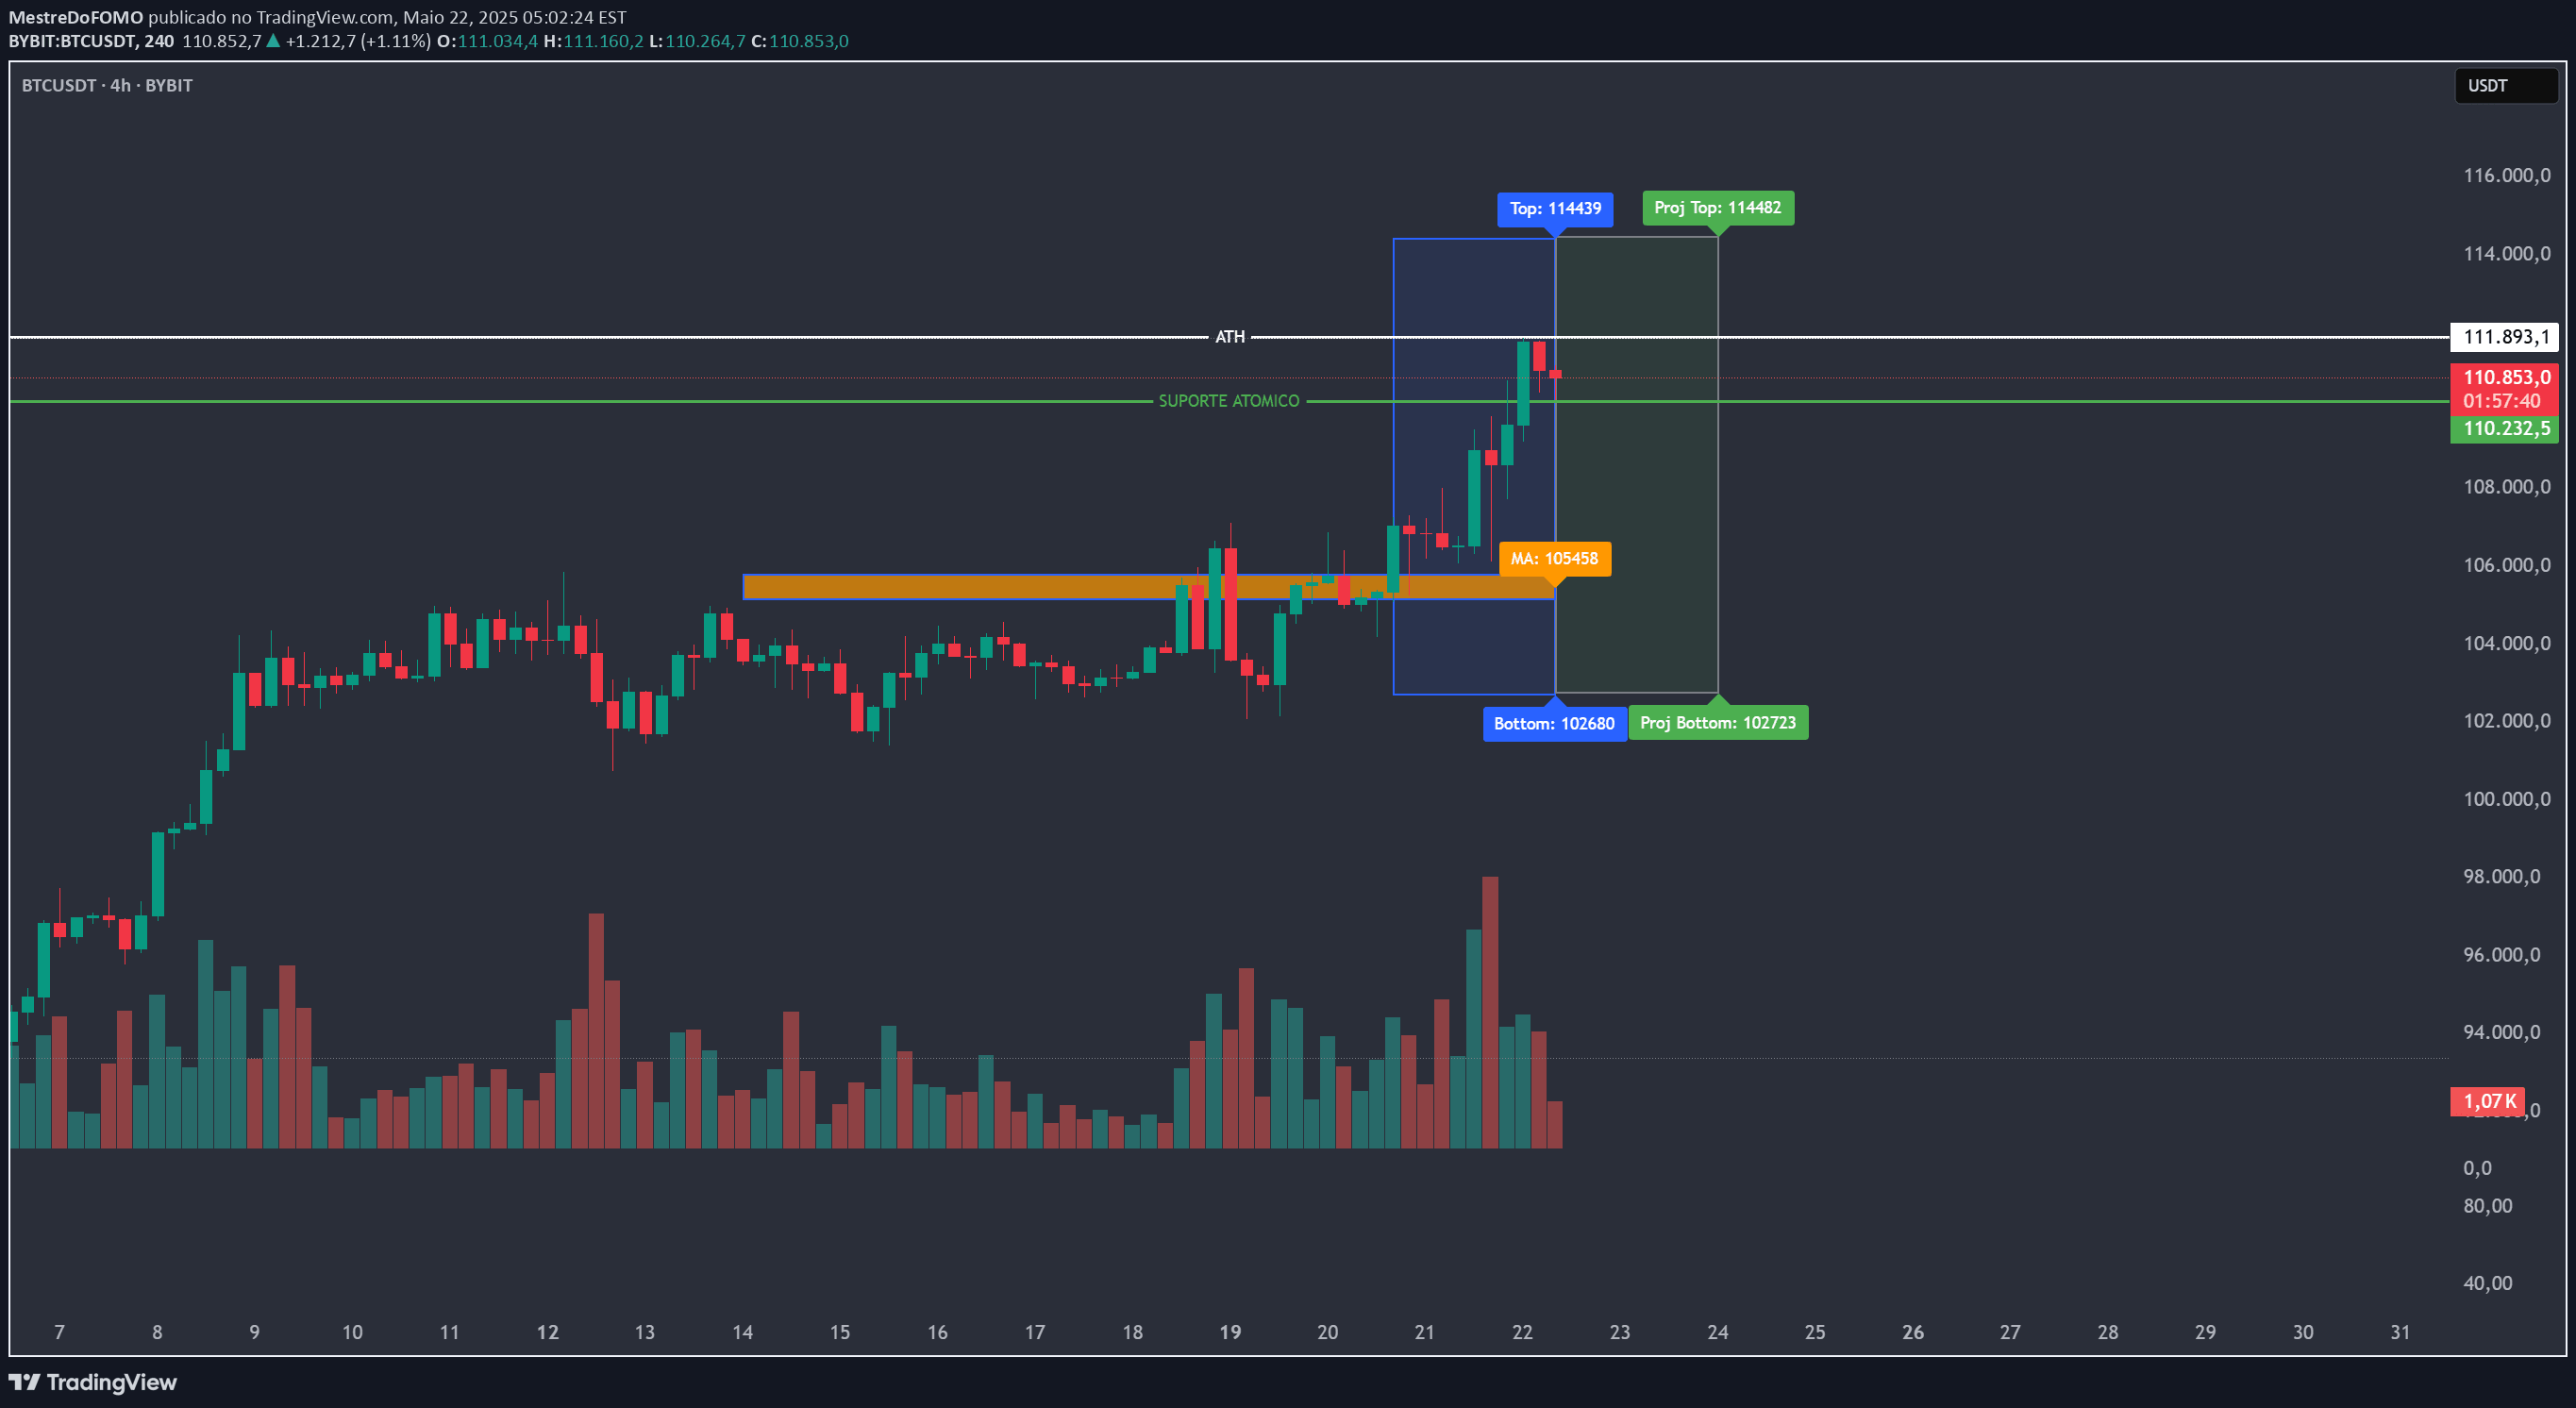
A custom indicator that tracks highest high, lowest low, and midpoint levels over a specified period, helping traders identify key price ranges and potential support or resistance zones.
Explore complementary indicator rolesHow it works
The indicator begins by allowing users to select a specific starting date and define the number of days to analyze. It then calculates the highest price reached and the lowest price within that specified time frame, creating three distinct horizontal lines on the chart. The red line represents the highest high, the green line shows the lowest low, and the blue line indicates the midpoint between these two extremes.
By dynamically tracking these price levels, the tool provides a visual representation of the recent price range. Traders can customize the analysis period, making it flexible for different trading styles and timeframes. The lines remain static for the chosen period, offering a clear view of the price boundaries and potential key trading levels.
Why it may be useful
This indicator is crucial for traders seeking to understand market dynamics and potential price limitations. By clearly demarcating the highest and lowest price points, it provides immediate insight into recent market behavior and potential resistance or support levels. Traders can quickly assess the price range and identify potential entry or exit points based on these key levels.
The midpoint line adds an additional layer of analysis, offering a neutral reference point between the extreme price levels. This can help traders gauge market sentiment and potential price reversals. By visualizing these levels, traders can make more informed decisions about market trends, potential breakouts, and overall price movement.
When to explore it
The indicator is most effective in markets with clear trending or ranging characteristics. It works particularly well when traders want to identify short-term price boundaries and potential trading opportunities. In volatile markets, it can help quickly assess recent price extremes and provide a framework for understanding market momentum.
Traders can utilize this tool across various timeframes, from scalping to swing trading. It is especially useful when analyzing new market trends, identifying potential breakout points, or establishing risk management strategies. The flexibility of choosing the analysis period makes it adaptable to different trading styles and market conditions.
Keep exploring
What we’ve verified
Access, alerts and repainting behaviour have not been independently verified for this indicator. Check the creator’s current publication and settings.
General descriptions and classifications are recovered research. Verified details above identify the specific checks we have completed. Check the creator’s current publication for later changes.