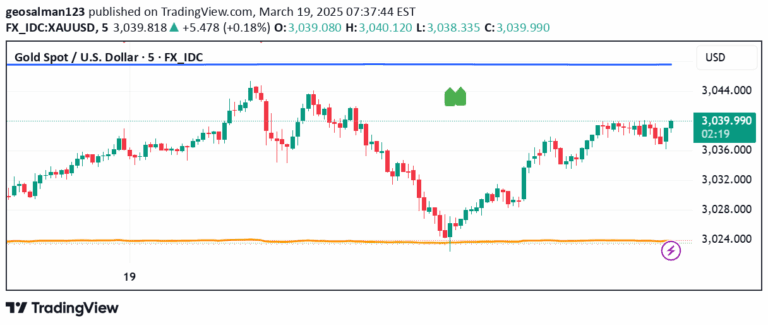
A logarithmic indicator that calculates price logarithms and applies a Simple Moving Average, providing insights into price movements across different scales and timeframes.
Explore complementary indicator rolesHow it works
The logarithmic indicator begins by converting price data into logarithmic values, typically using the close price and a base of 10. By transforming price data logarithmically, the indicator creates a different perspective on price movements that highlights percentage changes more effectively than linear representations.
After calculating the logarithmic values, the indicator applies a Simple Moving Average (SMA) to smooth out the data and identify underlying trends. The indicator also generates upper and lower bands based on the highest and lowest values over the past 100 periods, which helps traders visualize price volatility and potential support and resistance levels.
Why it may be useful
Logarithmic indicators provide traders with a more nuanced view of price movements by emphasizing percentage changes rather than absolute price differences. This approach allows traders to better understand market dynamics across different price ranges and timeframes, making it easier to identify trends and potential reversals.
By smoothing price data and creating visual bands, the indicator helps traders make more informed decisions about market direction and potential entry or exit points. The logarithmic transformation is particularly useful for assets with significant price variations, as it normalizes the data and makes percentage-based changes more apparent.
When to explore it
This logarithmic indicator is most effective when analyzing markets with high volatility or significant price variations, such as cryptocurrencies, emerging market stocks, or commodities. Traders can use this tool to gain insights into long-term trends and percentage-based price movements that might be obscured by traditional linear price charts.
The indicator is particularly valuable for traders seeking a comprehensive view of price dynamics across different timeframes. It can be especially useful for identifying potential trend reversals, assessing market momentum, and making more informed trading decisions based on normalized price data.
Keep exploring
What we’ve verified
Access, alerts and repainting behaviour have not been independently verified for this indicator. Check the creator’s current publication and settings.
General descriptions and classifications are recovered research. Verified details above identify the specific checks we have completed. Check the creator’s current publication for later changes.