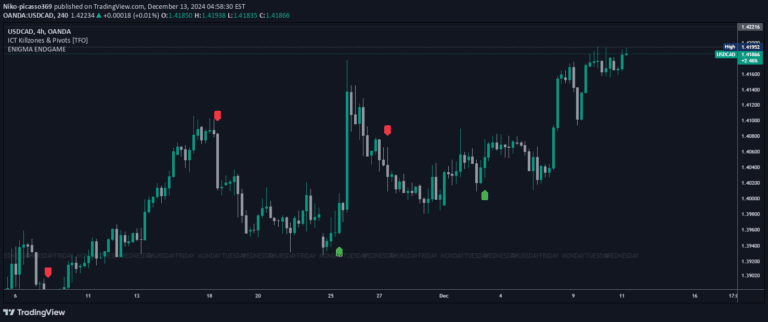
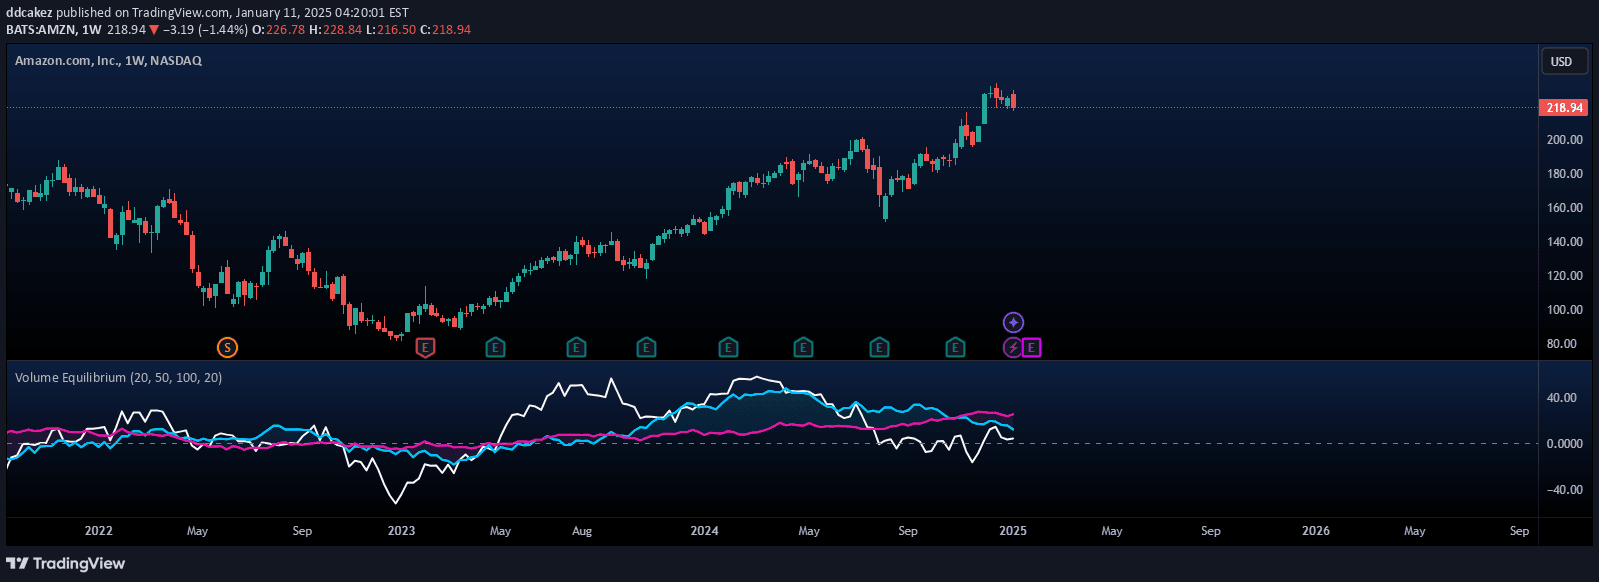
A unique trading indicator that combines liquidity zones, Fibonacci levels, and EMA filtering to generate precise buy and sell signals with visual trading insights.
Explore complementary indicator rolesHow it works
The ELC Indicator identifies liquidity grabs by detecting price movements beyond recent highs or lows, triggering buy or sell signals based on specific criteria. It uses a dynamic EMA filter to ensure signals align with the broader market trend, requiring price to be above or below the EMA for signal validation.
Once a signal is generated, the indicator plots multiple horizontal lines at key Fibonacci levels (0%, 25%, 50%, 75%, 100%, 120%, and 180%), providing traders with a visual framework for potential retracement or extension levels. These lines help traders identify precise entry points, set profit targets, and manage risk effectively.
Why it may be useful
The ELC Indicator offers traders a comprehensive approach to market analysis by integrating multiple sophisticated trading concepts into a single, actionable tool. By combining liquidity analysis, Fibonacci ratios, and trend filtering, it provides a more nuanced view of potential market movements compared to traditional lagging indicators.
Its unique design helps traders reduce false signals, align trades with market trends, and make more informed decisions across different trading styles and timeframes. The visual cues and customizable features make complex market analysis more accessible and intuitive for traders seeking high-probability trading opportunities.
When to explore it
The ELC Indicator performs optimally in markets with clear directional movements and identifiable liquidity zones, making it particularly effective during trending market conditions. It works best when price action demonstrates distinct swings and potential reversal points, allowing traders to capitalize on both trend-following and potential trend-reversal scenarios.
Traders can leverage this indicator across various markets and timeframes, from intraday scalping to longer-term swing trading. It is especially useful during periods of market volatility, where quick identification of potential entry and exit points can provide a significant competitive advantage.
Keep exploring
What we’ve verified
Access, alerts and repainting behaviour have not been independently verified for this indicator. Check the creator’s current publication and settings.
General descriptions and classifications are recovered research. Verified details above identify the specific checks we have completed. Check the creator’s current publication for later changes.