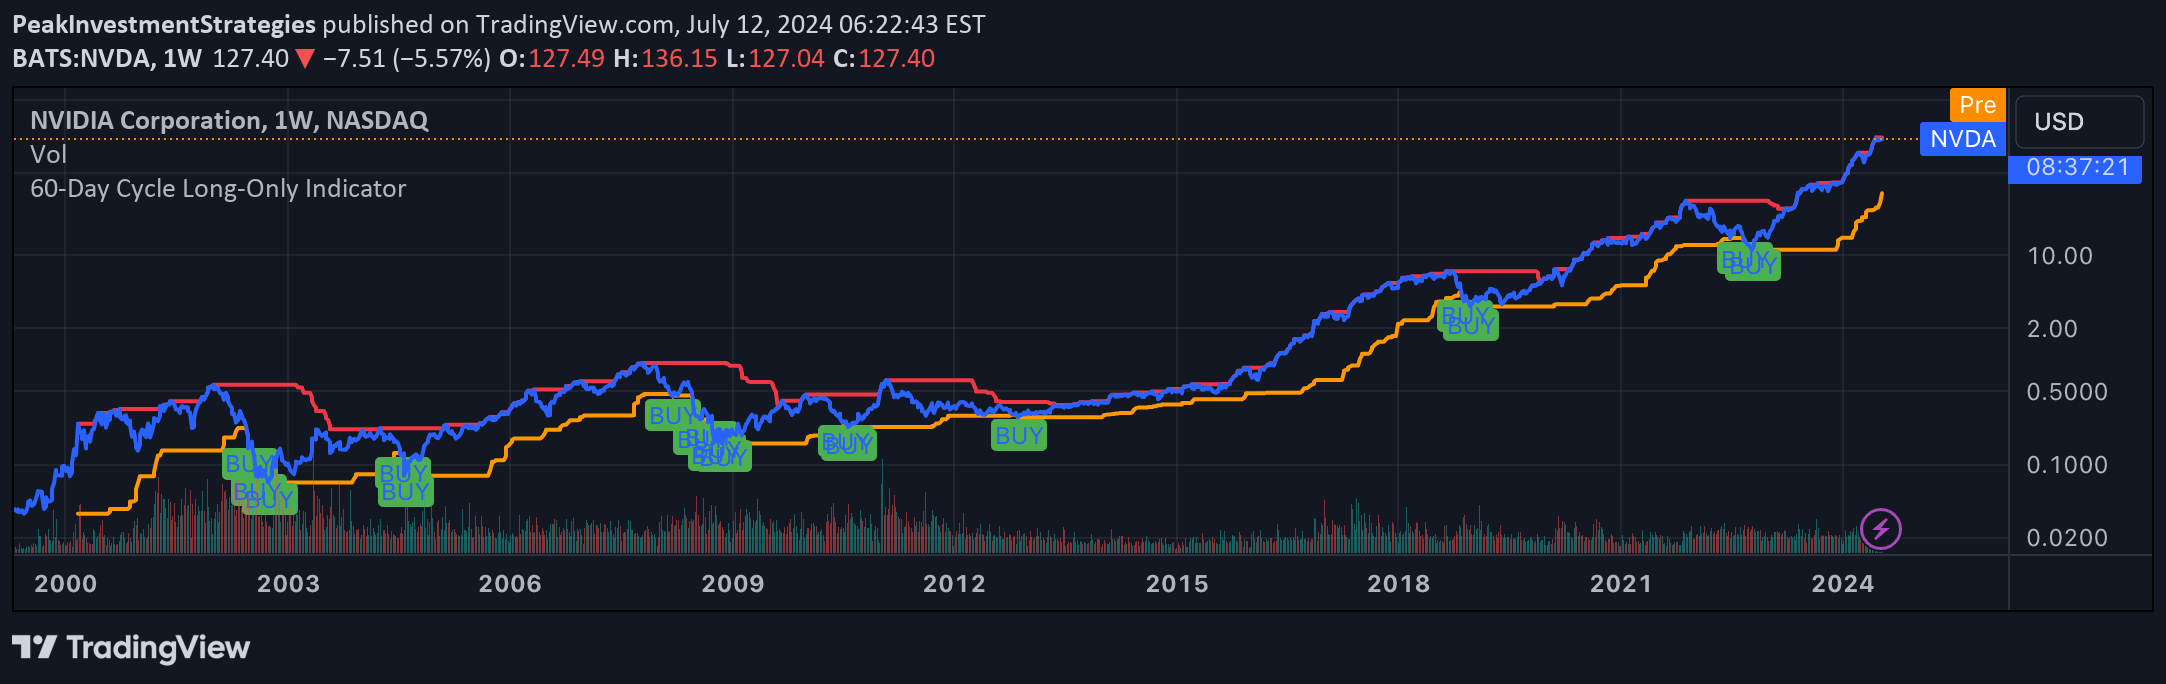
A 60-day cycle trading strategy that identifies market phases by tracking upper and lower price bounds, generating buy signals when price crosses the cycle low.
Explore complementary indicator rolesHow it works
The 60-day cycle strategy works by establishing dynamic price boundaries based on the highest and lowest closing prices over the past 60 trading days. It calculates two key levels: the cycle high (highest closing price) and the cycle low (lowest closing price), which create a visual trading range for the asset.
When the current closing price crosses above the cycle low, a buy signal is generated, indicating a potential end to the bearish phase and the start of a bullish trend. These boundaries are plotted as horizontal lines on the chart, with the cycle high in red and the cycle low in orange, helping traders quickly assess the current market phase.
Why it may be useful
This strategy provides traders with a systematic approach to understanding market cycles and identifying potential entry points based on price movement relative to recent historical performance. By tracking 60-day price boundaries, traders can gain insights into market sentiment and potential trend reversals.
The method helps traders recognize when an asset might be oversold or approaching an accumulation phase, allowing for more informed trading decisions. It offers a structured way to evaluate market conditions, reducing emotional trading and providing a clear visual representation of price dynamics over a consistent time frame.
When to explore it
The 60-day cycle strategy is most effective in markets with clear trending characteristics and for traders looking to capture medium-term price movements. It works best in assets that demonstrate consistent cyclical behavior and have sufficient liquidity to support meaningful price trends.
This approach is particularly useful for swing traders who want to identify potential entry points during longer-term market cycles. It is most suitable for assets that show predictable price patterns and can benefit from a structured approach to identifying market phases and potential trend reversals.
Keep exploring
What we’ve verified
Access, alerts and repainting behaviour have not been independently verified for this indicator. Check the creator’s current publication and settings.
General descriptions and classifications are recovered research. Verified details above identify the specific checks we have completed. Check the creator’s current publication for later changes.