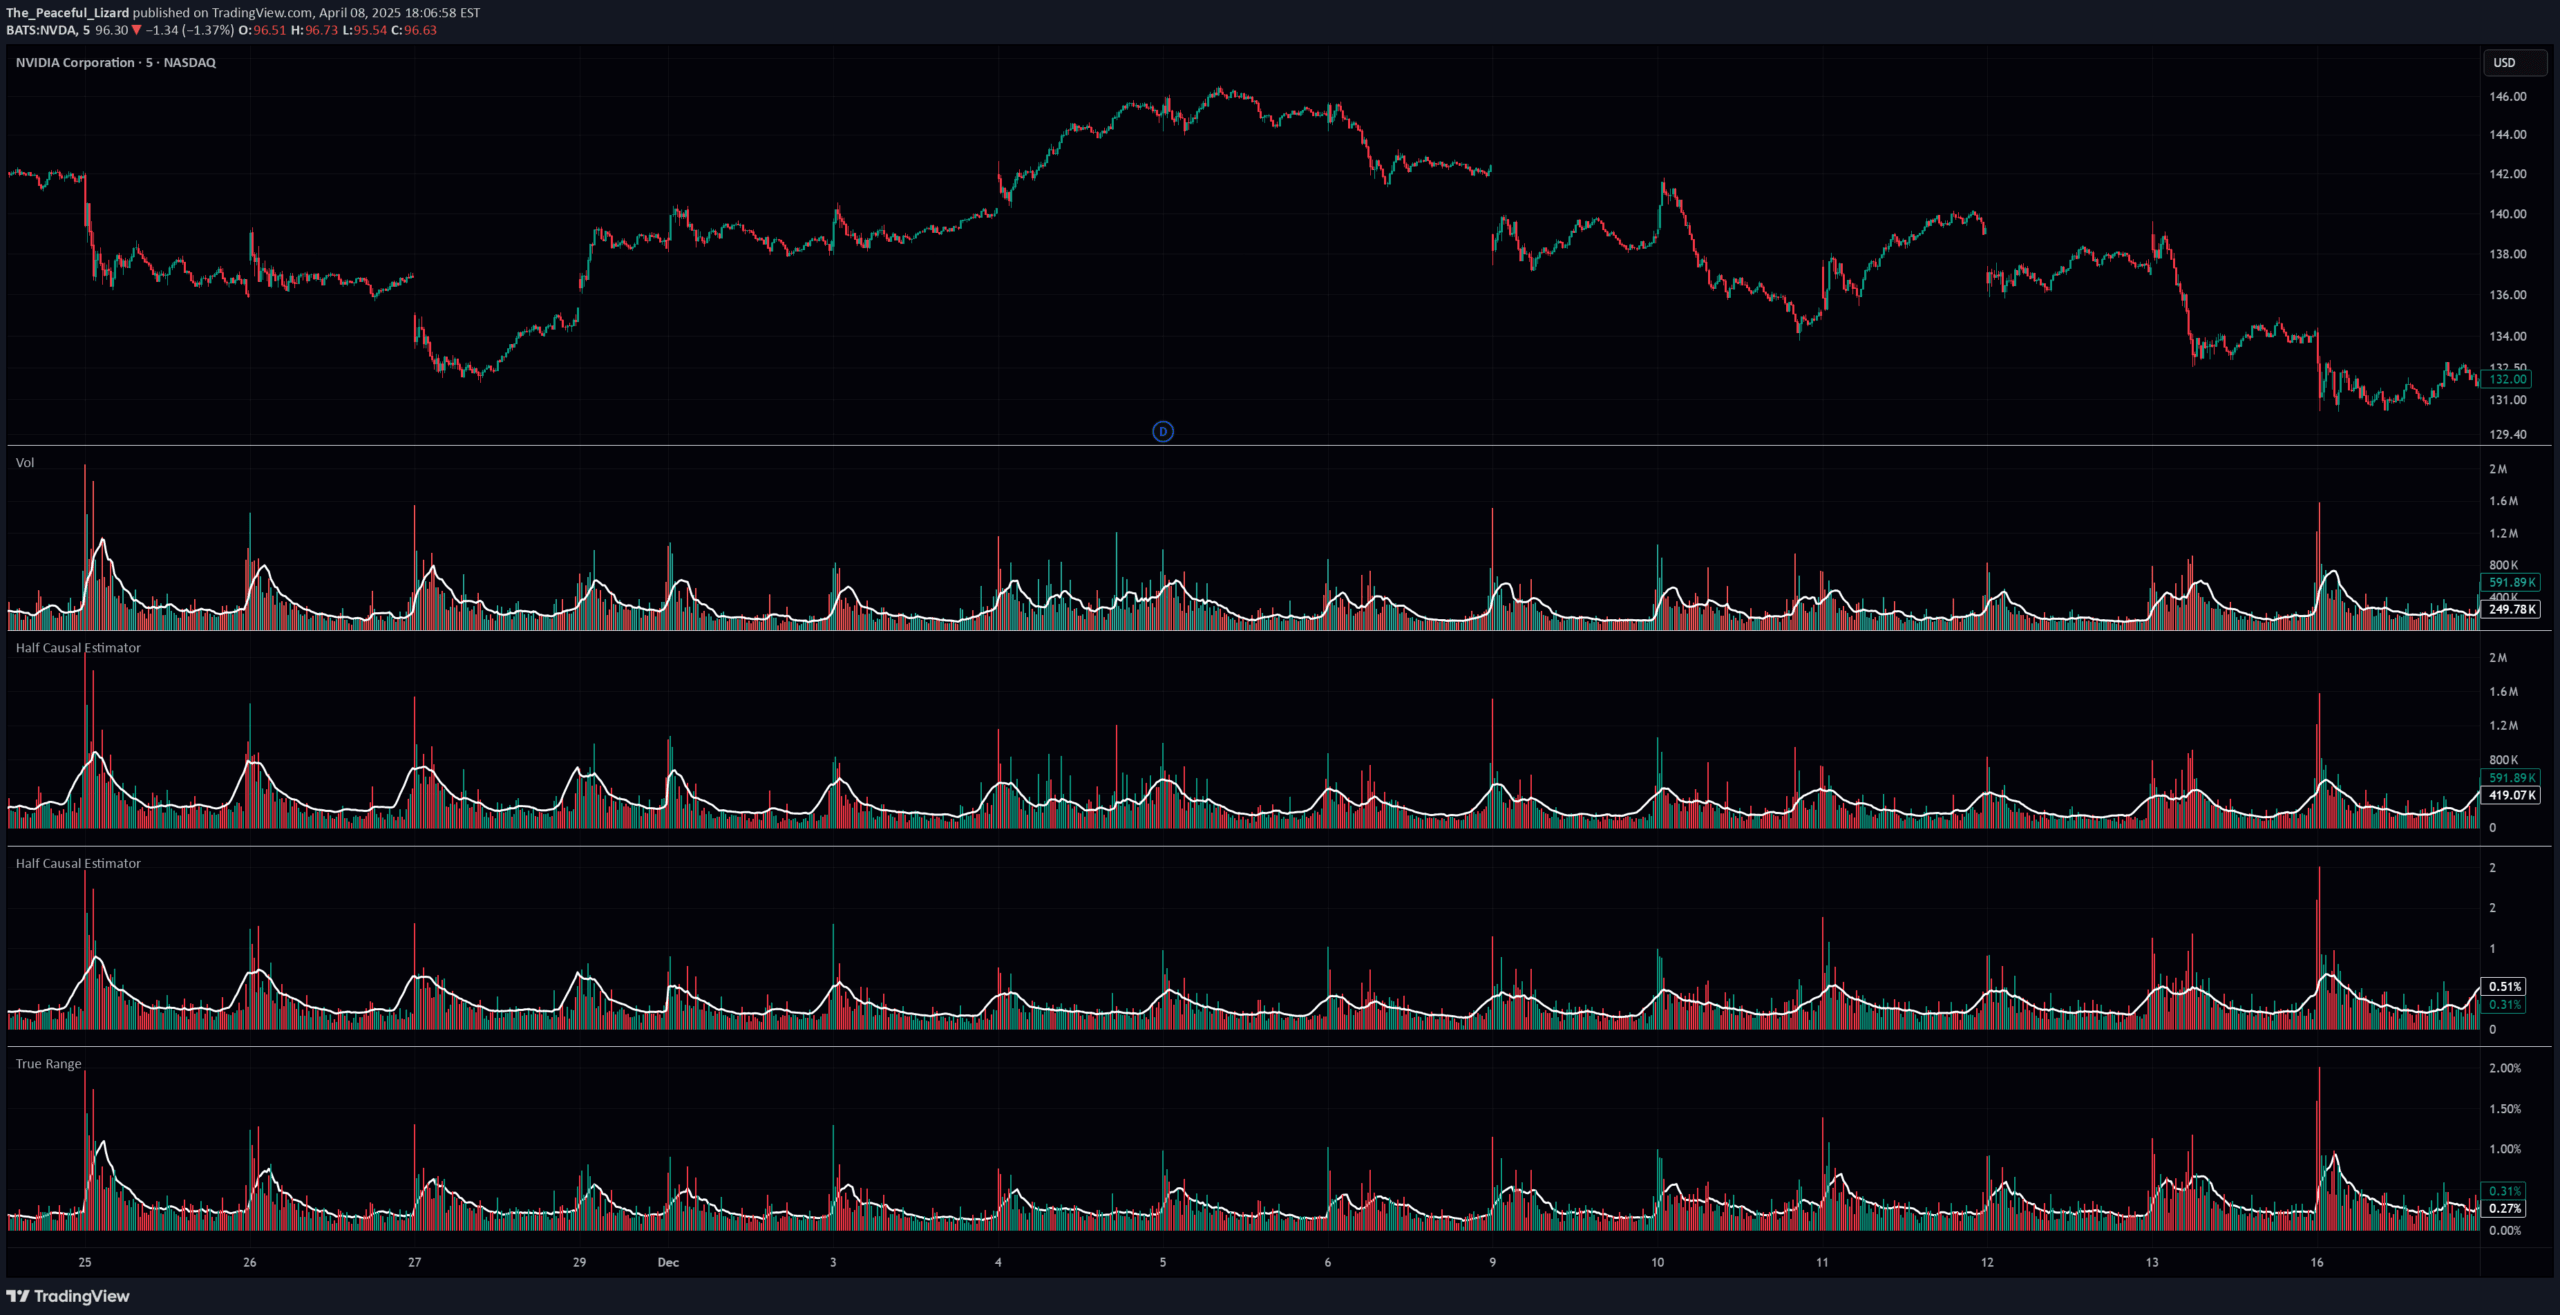
A specialized filtering method that provides responsive market variable averages with reduced time delay by leveraging historical data and time-of-day patterns for more timely analysis.
Explore complementary indicator rolesHow it works
The Half Causal Estimator works by creating a hybrid filtering window that combines recent actual market data with historical time-of-day patterns. It stores and organizes market data by specific times of day, building a profile of typical behavior.
The indicator then creates a calculation window where half consists of recent data and half of expected future values based on historical patterns. A kernel-based smoothing function is applied to weight the values in this composite window, with different kernel types like Gaussian, Epanechnikov, and Triangular providing varying smoothing characteristics
Why it may be useful
This indicator addresses the critical limitation of time lag in traditional moving averages by incorporating predictable market patterns. It provides more timely signals about market variables like volume, true range, and price changes.
The approach allows traders to detect volume climaxes, volatility shifts, and price momentum changes earlier than conventional indicators. By reducing lag while maintaining smoothing benefits, it offers a more responsive analytical tool that can help traders make more informed and timely decisions in dynamic market conditions
When to explore it
The Half Causal Estimator is most effective in minute-based intraday timeframes with securities that have consistent volume data. It works best when traders need early insights into market trends and want to minimize the impact of traditional indicator lag.
The method is particularly useful for algorithmic trading systems, day traders, and swing traders who require quick, smooth analysis of market variables. It excels in markets with recognizable intraday patterns and when precise, timely information about volume, volatility, or price changes is crucial for decision-making
Keep exploring
What we’ve verified
Access, alerts and repainting behaviour have not been independently verified for this indicator. Check the creator’s current publication and settings.
General descriptions and classifications are recovered research. Verified details above identify the specific checks we have completed. Check the creator’s current publication for later changes.