
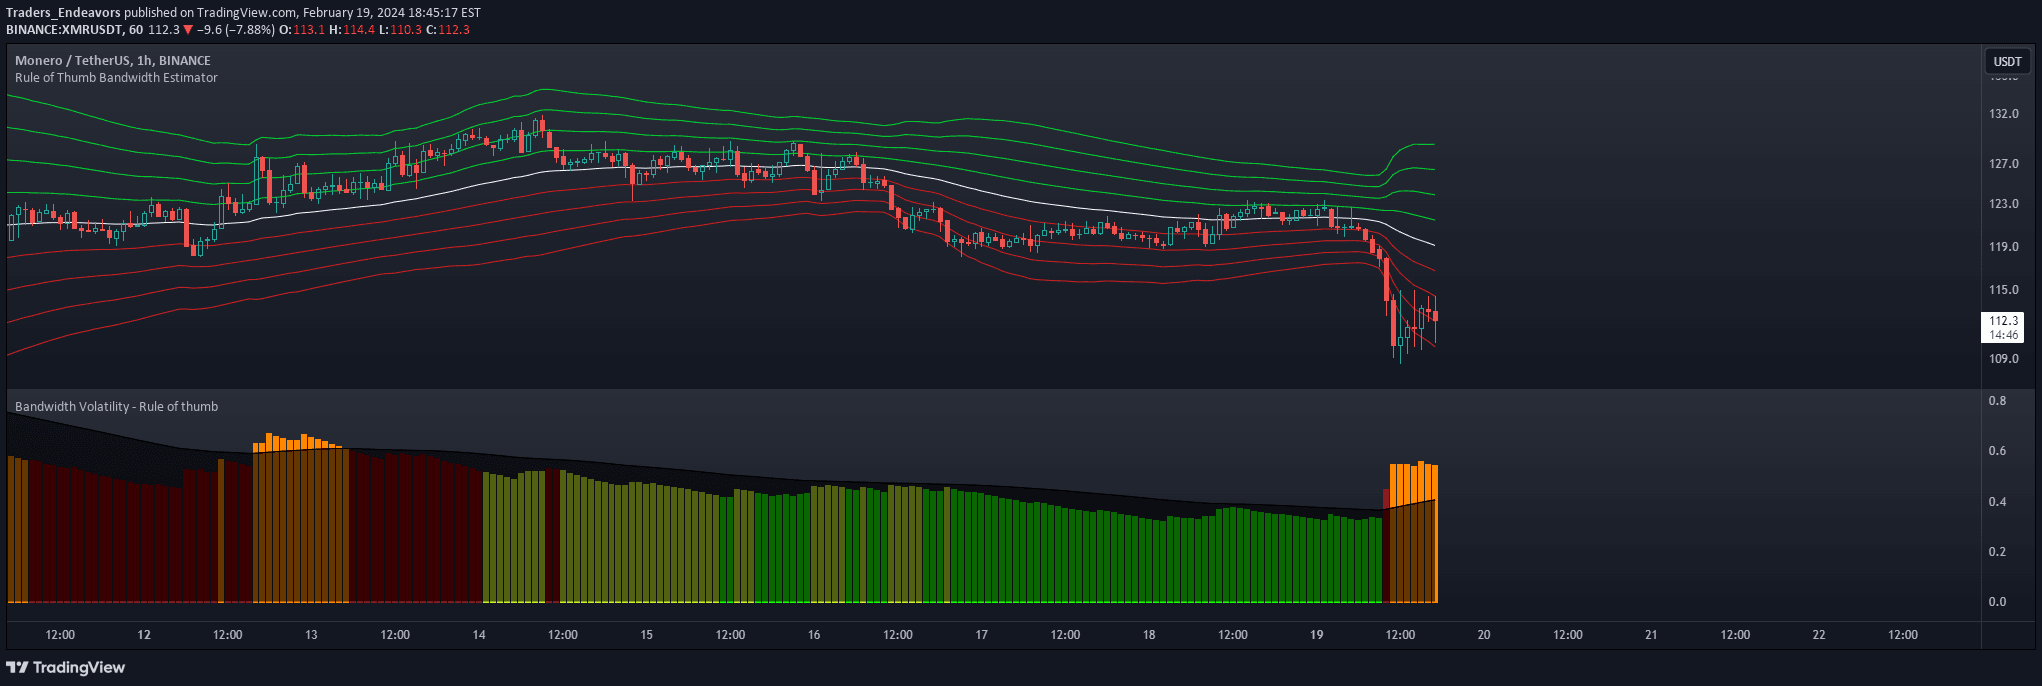
A volatility indicator using rule of thumb bandwidth estimator to measure market fluctuations by analyzing returns and standard deviations with color-coded visualization.
Explore complementary indicator rolesHow it works
This volatility indicator calculates bandwidth using two primary methods: the original Silverman rule of thumb and a modified version incorporating interquartile range. The original method uses standard deviation and number of data points to estimate bandwidth, creating a foundational volatility measurement.
The modified approach enhances the original formula by introducing a 0.9 multiplier and using the minimum of standard deviation or interquartile range divided by 1.34. This modification provides a more robust estimation, particularly for financial time series with potentially non-Gaussian distributions, allowing for more adaptable volatility analysis.
Why it may be useful
Volatility indicators help traders understand market dynamics by revealing potential price movement ranges and market uncertainty levels. By providing insights into potential market expansions and contractions, this bandwidth estimator allows traders to anticipate potential trading opportunities and manage risk more effectively.
The indicator's ability to adapt to different data distributions makes it particularly valuable for traders seeking a flexible volatility measurement tool. Its color-coded visualization and moving average components enable quick identification of volatility trends, helping traders make more informed decisions about market entry and exit points.
When to explore it
This volatility indicator is most effective during periods of market uncertainty or when traders want to assess potential price movement ranges. It works exceptionally well in markets experiencing significant fluctuations, helping traders identify potential breakout or trend reversal scenarios.
Traders should utilize this indicator when seeking to understand underlying market volatility beyond simple price movements. It is particularly useful in analyzing assets with potentially complex return distributions, such as stocks, cryptocurrencies, and forex pairs, where traditional volatility measures might provide incomplete insights.
Keep exploring
What we’ve verified
Access, alerts and repainting behaviour have not been independently verified for this indicator. Check the creator’s current publication and settings.
General descriptions and classifications are recovered research. Verified details above identify the specific checks we have completed. Check the creator’s current publication for later changes.


