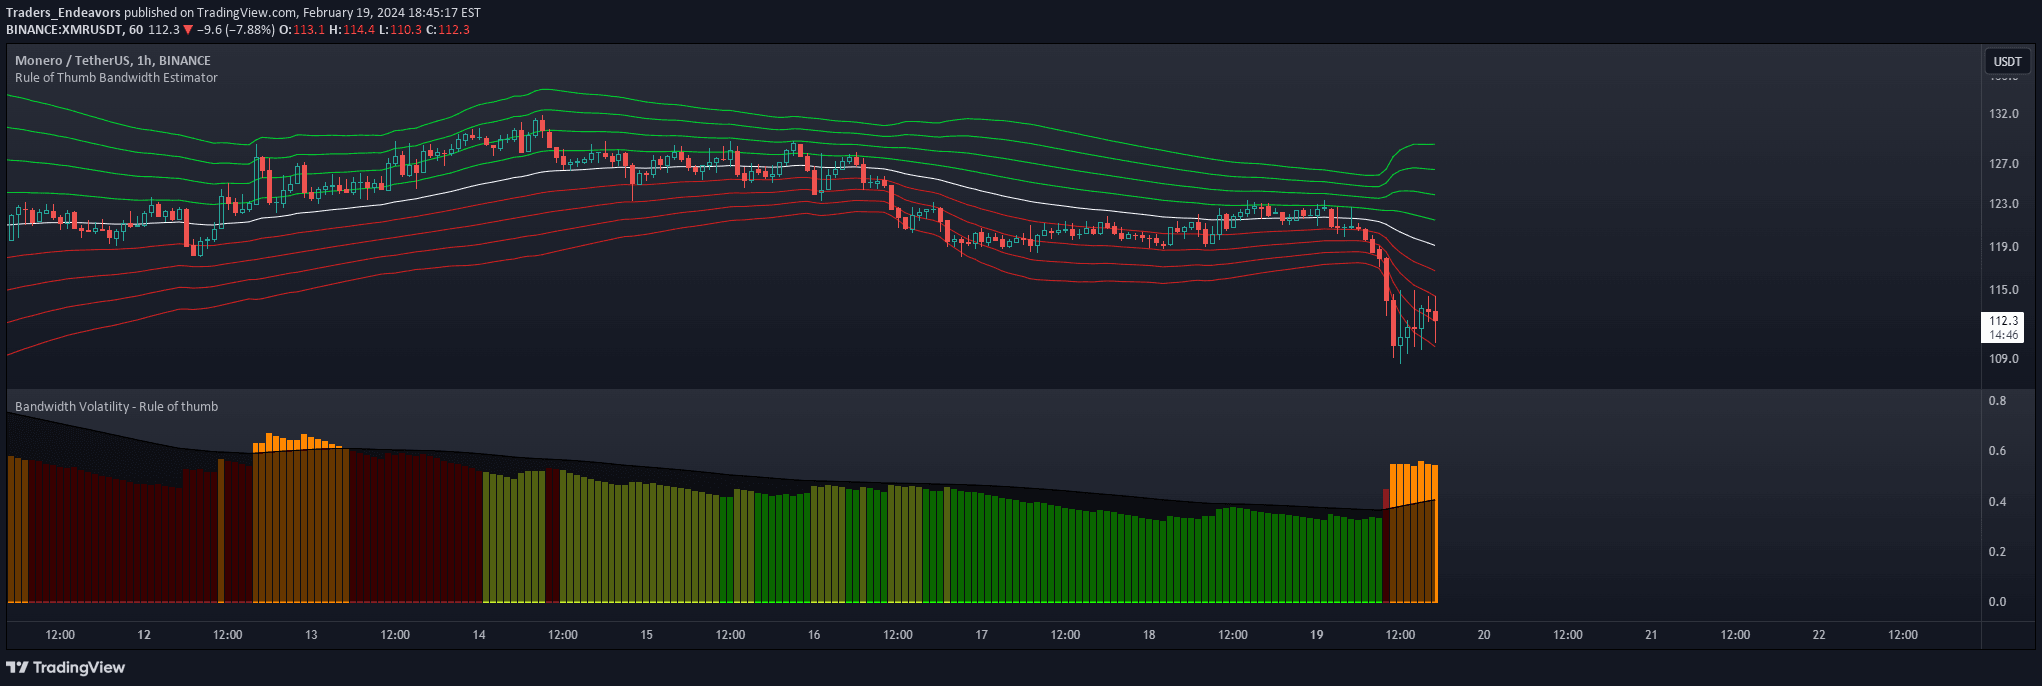
Bandwidth Bands use Silverman's Rule of Thumb to create dynamic volatility bands around a moving average, offering insights into price distribution and market volatility.
Explore complementary indicator rolesHow it works
The Bandwidth Bands indicator starts by applying a log transformation to price data, which helps reduce skewness and normalize the distribution. It then calculates the Silverman Rule of Thumb Bandwidth, a statistical method that dynamically estimates optimal band width based on the underlying data characteristics.
After determining the bandwidth, the indicator creates bands around a rolling moving average, using the calculated width to define volatility zones. The logarithmic transformation is reversed using an exponential function, returning the bands to a right-skewed distribution that reflects market price behavior.
Why it may be useful
Bandwidth Bands provide traders with a sophisticated and adaptive approach to understanding market volatility beyond traditional standard deviation methods. By considering the entire data distribution rather than just spread, these bands offer more nuanced insights into potential price movements and market conditions.
The dynamic nature of the Silverman Rule of Thumb allows traders to quickly assess changing market volatility without complex computational processes. This makes the indicator particularly valuable for identifying potential trading ranges, breakout opportunities, and understanding the underlying market structure.
When to explore it
Bandwidth Bands are most effective in markets with complex price distributions and varying volatility levels. They work exceptionally well in financial instruments that experience significant price fluctuations, such as cryptocurrencies, growth stocks, and commodities.
Traders can leverage these bands during periods of market uncertainty, using them to identify potential trend reversals, assess market regime changes, and determine appropriate position sizing based on current volatility conditions. The indicator is particularly useful when combined with other trend and momentum indicators to confirm trading signals.
Keep exploring
What we’ve verified
Access, alerts and repainting behaviour have not been independently verified for this indicator. Check the creator’s current publication and settings.
General descriptions and classifications are recovered research. Verified details above identify the specific checks we have completed. Check the creator’s current publication for later changes.