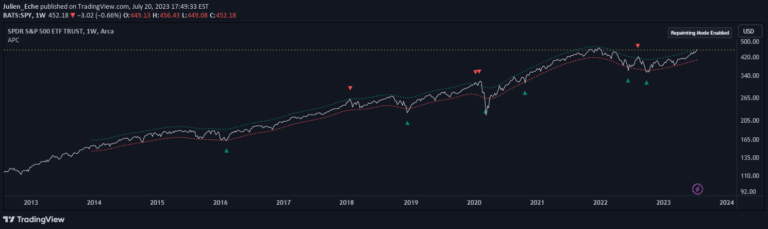
Multi Kernel Regression [ChartPrime]
A versatile trading indicator using kernel regression to smooth price data and reveal market trends through customizable regression lines and kernel types.
Explore 11,183 indicators. Filter beyond the obvious.
Discover the tools that fit the way you trade.
11,183 tools to explore
A versatile trading indicator using kernel regression to smooth price data and reveal market trends through customizable regression lines and kernel types.
The Bollinger Band Width Percentile measures relative volatility by calculating the percentage of historical periods where Bollinger Band width was narrower than the current period.
Advanced machine learning trading tool using kernel regression to predict price targets and trends. Provides dynamic analysis with customizable settings for enhanced trading decision-making.
A trading signal that measures market volatility by comparing bandwidth from different channel indicators with Average True Range (ATR) to identify low and high volatility zones.
An experimental scalping overlay combining Andean Oscillator signals with a relative-bandwidth filter. It displays long and short markers and includes alerts.
An adaptive trading indicator using logarithmic price scaling and Nadaraya-Watson estimation to create dynamic price channels that adjust to market conditions and provide potential trading signals.
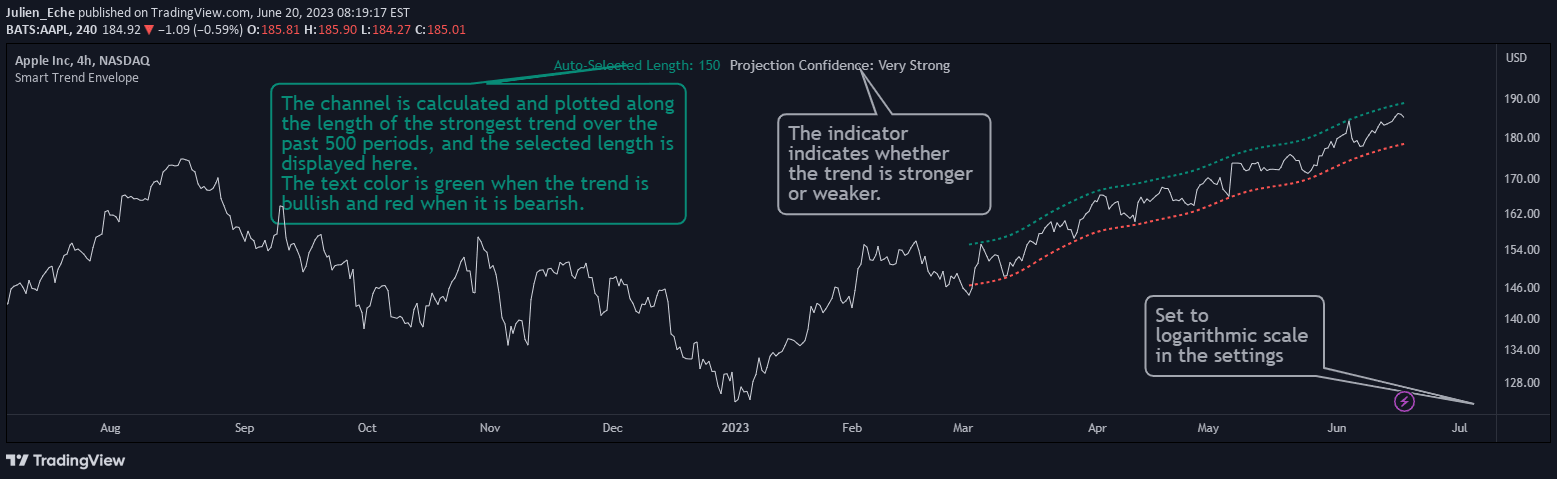
A dynamic trading indicator that combines trendline analysis and price smoothing to identify market trends with automatic length selection and projection confidence levels.
A sophisticated moving average technique using Gaussian kernel smoothing to reduce price noise and capture underlying market trends with dynamic bandwidth adaptation.
A statistical analysis tool using Nadaraya-Watson estimation to create probability bands around price movements, revealing potential market trends and volatility insights.
A trading signal that detects price crashes using multiple Bollinger Bands with increasing standard deviation multipliers, identifying potential buying opportunities during high volatility.
Multi-timeframe Bollinger BandWidth Indicator that analyzes market volatility and trend strength across different timeframes, helping traders make informed trading decisions.
A refined MACD indicator using a biquad band pass filter to identify momentum and trend changes with enhanced precision and adaptability in price movements.
Likes, views, and comments are historical TradingView snapshots. They describe attention, not trading performance.