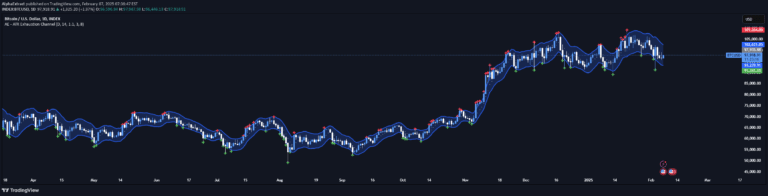
A trading signal that measures market volatility by comparing bandwidth from different channel indicators with Average True Range (ATR) to identify low and high volatility zones.
Explore complementary indicator rolesHow it works
This volatility signal works by calculating a Relative Bandwidth, which compares the bandwidth of a higher-length channel indicator (Bollinger, Keltner, or Donchian) with a lower-length ATR. By comparing these values, the script determines the current market volatility state.
A higher relative bandwidth suggests low volatility, while a lower relative bandwidth indicates high volatility. The signal then applies Bollinger Bands to this relative bandwidth to further quantify volatility levels and generate trading signals
Why it may be useful
This volatility signal matters because it provides traders with a systematic method to assess market conditions before entering trades. By measuring relative volatility, traders can avoid trading during periods of unfavorable market conditions.
The signal helps filter out potential low-probability trade setups by identifying whether the market is in a high or low volatility state. This approach can improve risk management and help traders make more informed decisions about trade entry and exit points
When to explore it
This volatility signal works best during trending and range-bound markets where consistent volatility patterns emerge. It is particularly useful for traders who want to avoid trading during periods of extreme or unpredictable price fluctuations.
The signal can be most effective when combined with other technical indicators and used across different timeframes. Traders should pay special attention to the signal during market transitions, economic news releases, and periods of potential trend reversals
Keep exploring
What we’ve verified
Access, alerts and repainting behaviour have not been independently verified for this indicator. Check the creator’s current publication and settings.
General descriptions and classifications are recovered research. Verified details above identify the specific checks we have completed. Check the creator’s current publication for later changes.